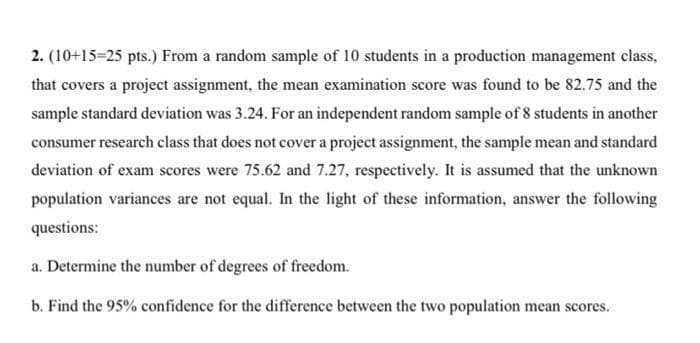
2. (10+15=25 pts.) From a random sample of 10 students in a production management class, that covers a project assignment, the mean examination score was found to be 82.75 and the sample standard deviation was 3.24. For an independent random sample of 8 students in another consumer research class that does not cover a project assignment, the sample mean and standard deviation of exam scores were 75.62 and 7.27, respectively. It is assumed that the unknown population variances are not equal. In the light of these information, answer the following questions: a. Determine the number of degrees of freedom. b. Find the 95% confidence for the difference between the two population mean scores.
2. (10+15=25 pts.) From a random sample of 10 students in a production management class, that covers a project assignment, the mean examination score was found to be 82.75 and the sample standard deviation was 3.24. For an independent random sample of 8 students in another consumer research class that does not cover a project assignment, the sample mean and standard deviation of exam scores were 75.62 and 7.27, respectively. It is assumed that the unknown population variances are not equal. In the light of these information, answer the following questions: a. Determine the number of degrees of freedom. b. Find the 95% confidence for the difference between the two population mean scores.

MATLAB: An Introduction with Applications
6th Edition
ISBN:9781119256830
Author:Amos Gilat
Publisher:Amos Gilat
Chapter1: Starting With Matlab
Section: Chapter Questions
Problem 1P

Related questions
Topic Video
Question
Transcribed Image Text:2. (10+15=25 pts.) From a random sample of 10 students in a production management class,
that covers a project assignment, the mean examination score was found to be 82.75 and the
sample standard deviation was 3.24. For an independent random sample of 8 students in another
consumer research class that does not cover a project assignment, the sample mean and standard
deviation of exam scores were 75.62 and 7.27, respectively. It is assumed that the unknown
population variances are not equal. In the light of these information, answer the following
questions:
a. Determine the number of degrees of freedom.
b. Find the 95% confidence for the difference between the two population mean scores.
Expert Solution
This question has been solved!
Explore an expertly crafted, step-by-step solution for a thorough understanding of key concepts.

Step by step
Solved in 2 steps with 3 images

Knowledge Booster


Learn more about
Need a deep-dive on the concept behind this application? Look no further. Learn more about this topic, statistics and related others by exploring similar questions and additional content below.Recommended textbooks for you
MATLAB: An Introduction with Applications
Statistics
ISBN:
9781119256830
Author:
Amos Gilat
Publisher:
John Wiley & Sons Inc

Probability and Statistics for Engineering and th…
Statistics
ISBN:
9781305251809
Author:
Jay L. Devore
Publisher:
Cengage Learning

Statistics for The Behavioral Sciences (MindTap C…
Statistics
ISBN:
9781305504912
Author:
Frederick J Gravetter, Larry B. Wallnau
Publisher:
Cengage Learning
MATLAB: An Introduction with Applications
Statistics
ISBN:
9781119256830
Author:
Amos Gilat
Publisher:
John Wiley & Sons Inc
Probability and Statistics for Engineering and th…
Statistics
ISBN:
9781305251809
Author:
Jay L. Devore
Publisher:
Cengage Learning
Statistics for The Behavioral Sciences (MindTap C…
Statistics
ISBN:
9781305504912
Author:
Frederick J Gravetter, Larry B. Wallnau
Publisher:
Cengage Learning

Elementary Statistics: Picturing the World (7th E…
Statistics
ISBN:
9780134683416
Author:
Ron Larson, Betsy Farber
Publisher:
PEARSON

The Basic Practice of Statistics
Statistics
ISBN:
9781319042578
Author:
David S. Moore, William I. Notz, Michael A. Fligner
Publisher:
W. H. Freeman

Introduction to the Practice of Statistics
Statistics
ISBN:
9781319013387
Author:
David S. Moore, George P. McCabe, Bruce A. Craig
Publisher:
W. H. Freeman