2. An individual's present route to wark results in, on average, 40 minutes of travel time per trip. An alternate raute has been suggested by a friend, who claims that it will reduce the travel time. Suppose that the new route was tried on 10 randomly chosen accasions with the following times resulting: 44, 38.5, 37.5, 39, 38.2, 36, 42, 36.5, 36, 34 Do these data establish the claim that the new route is sharter, at the (a) 1 percent (b) 5 percent (c) 10 percent level of significance?
2. An individual's present route to wark results in, on average, 40 minutes of travel time per trip. An alternate raute has been suggested by a friend, who claims that it will reduce the travel time. Suppose that the new route was tried on 10 randomly chosen accasions with the following times resulting: 44, 38.5, 37.5, 39, 38.2, 36, 42, 36.5, 36, 34 Do these data establish the claim that the new route is sharter, at the (a) 1 percent (b) 5 percent (c) 10 percent level of significance?

MATLAB: An Introduction with Applications
6th Edition
ISBN:9781119256830
Author:Amos Gilat
Publisher:Amos Gilat
Chapter1: Starting With Matlab
Section: Chapter Questions
Problem 1P

Related questions
Topic Video
Question
100%
Transcribed Image Text:1.
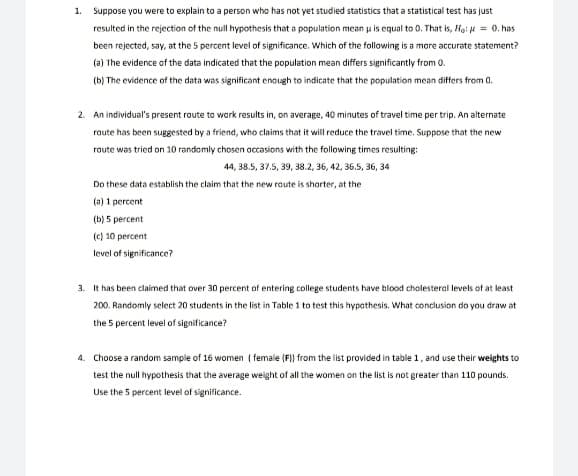
Suppose you were to explain to a person who has not yet studied statistics that a statistical test has just
resulted in the rejection of the null hypothesis that a population mean u is equal to 0. That is, lig: = 0. has
been rejected, say, at the 5 percent level of significance. Which of the following is a more accurate statement?
(a) The evidence of the data indicated that the population mean differs significantly from 0.
(b) The evidence of the data was significant enough to indicate that the population mean differs from 0.
2. An individual's present route to work results in, on average, 40 minutes of travel time per trip. An alternate
route has been suggested by a friend, who claims that it will reduce the travel time. Suppose that the new
route was tried on 10 randomly chosen occasions with the following times resulting:
44, 38.5, 37.5, 39, 38.2, 36, 42, 36.5, 36, 34
Do these data establish the claim that the new route is sharter, at the
(a) 1 percent
(b) 5 percent
(c) 10 percent
level of significance?
3. It has been claimed that over 30 percent of entering college students have blood cholesteral levels of at least
200. Randomly select 20 students in the list in Table 1 to test this hypothesis. What conclusion do you draw at
the 5 percent level of significance?
4. Choose a random sample of 16 women ( female (F)) from the list provided in table 1, and use their weights to
test the null hypothesis that the average weight of all the women on the list is not greater than 110 pounds.
Use the 5 percent level of significance.
Expert Solution
This question has been solved!
Explore an expertly crafted, step-by-step solution for a thorough understanding of key concepts.

Step by step
Solved in 2 steps

Knowledge Booster


Learn more about
Need a deep-dive on the concept behind this application? Look no further. Learn more about this topic, statistics and related others by exploring similar questions and additional content below.Recommended textbooks for you
MATLAB: An Introduction with Applications
Statistics
ISBN:
9781119256830
Author:
Amos Gilat
Publisher:
John Wiley & Sons Inc

Probability and Statistics for Engineering and th…
Statistics
ISBN:
9781305251809
Author:
Jay L. Devore
Publisher:
Cengage Learning

Statistics for The Behavioral Sciences (MindTap C…
Statistics
ISBN:
9781305504912
Author:
Frederick J Gravetter, Larry B. Wallnau
Publisher:
Cengage Learning
MATLAB: An Introduction with Applications
Statistics
ISBN:
9781119256830
Author:
Amos Gilat
Publisher:
John Wiley & Sons Inc
Probability and Statistics for Engineering and th…
Statistics
ISBN:
9781305251809
Author:
Jay L. Devore
Publisher:
Cengage Learning
Statistics for The Behavioral Sciences (MindTap C…
Statistics
ISBN:
9781305504912
Author:
Frederick J Gravetter, Larry B. Wallnau
Publisher:
Cengage Learning

Elementary Statistics: Picturing the World (7th E…
Statistics
ISBN:
9780134683416
Author:
Ron Larson, Betsy Farber
Publisher:
PEARSON

The Basic Practice of Statistics
Statistics
ISBN:
9781319042578
Author:
David S. Moore, William I. Notz, Michael A. Fligner
Publisher:
W. H. Freeman

Introduction to the Practice of Statistics
Statistics
ISBN:
9781319013387
Author:
David S. Moore, George P. McCabe, Bruce A. Craig
Publisher:
W. H. Freeman