2. Based on statistical analyses of the study provided below, how will you: a) identify and explain which is more appropriate; b) determine your decision, and; c) interpret results? Table 1. T-test for Independent Samples from a sample study Independent Samples Test t-test for Equality of Means Levene's Test for Equality of Variances F Sig. t df Sig. (2- Mean Std. tailed) Difference 95% Confidence Interval of the Error Differenc Difference e Lower Upper Equal variances assumed 9.531 -68556 10160 -.90094 -47017 Weight Equal variances not -.90966-46145 assumed Table 2. T-test for Dependent Samples from a sample study Paired Samples Test Paired Differences df Sig. (2- Mean Std. tailed) Std. Error Mean Deviation Pair 1 Treatment - Weight -.07278 007-6.748 16 .000 -6.748 10.807 .000 -68556 10160 t 26437 95% Confidence Interval of the Difference Lower Upper 0623120425 05869-168 17 259
2. Based on statistical analyses of the study provided below, how will you: a) identify and explain which is more appropriate; b) determine your decision, and; c) interpret results? Table 1. T-test for Independent Samples from a sample study Independent Samples Test t-test for Equality of Means Levene's Test for Equality of Variances F Sig. t df Sig. (2- Mean Std. tailed) Difference 95% Confidence Interval of the Error Differenc Difference e Lower Upper Equal variances assumed 9.531 -68556 10160 -.90094 -47017 Weight Equal variances not -.90966-46145 assumed Table 2. T-test for Dependent Samples from a sample study Paired Samples Test Paired Differences df Sig. (2- Mean Std. tailed) Std. Error Mean Deviation Pair 1 Treatment - Weight -.07278 007-6.748 16 .000 -6.748 10.807 .000 -68556 10160 t 26437 95% Confidence Interval of the Difference Lower Upper 0623120425 05869-168 17 259

College Algebra (MindTap Course List)
12th Edition
ISBN:9781305652231
Author:R. David Gustafson, Jeff Hughes
Publisher:R. David Gustafson, Jeff Hughes
Chapter8: Sequences, Series, And Probability
Section8.7: Probability
Problem 58E: What is meant by the sample space of an experiment?

Related questions
Question
100%
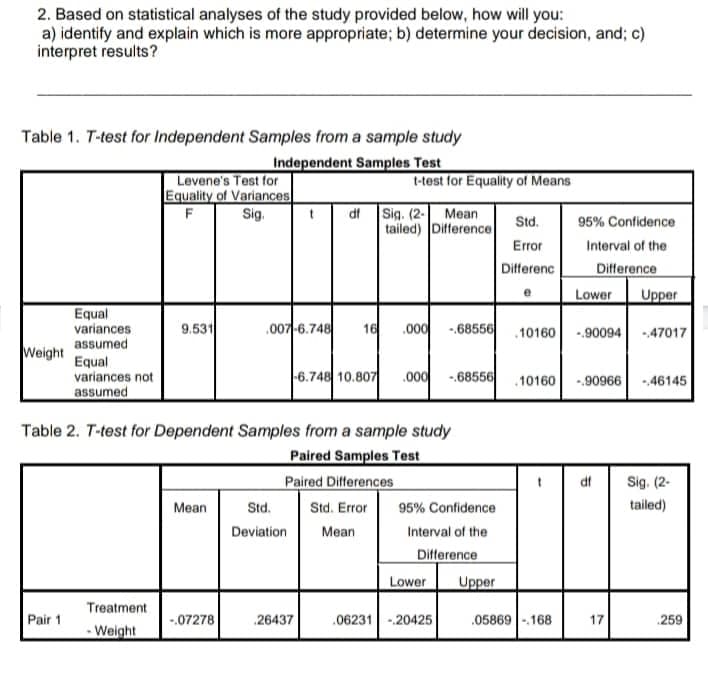
Transcribed Image Text:2. Based on statistical analyses of the study provided below, how will you:
a) identify and explain which is more appropriate; b) determine your decision, and; c)
interpret results?
Table 1. T-test for Independent Samples from a sample study
Independent Samples Test
t-test for Equality of Means
Levene's Test for
Equality of Variances
F Sig.
df Sig. (2- Mean
95% Confidence
tailed) Difference
Std.
Error
Interval of the
Differenc
Difference
e
Lower Upper
Equal
variances
assumed
9.531
007-6.748 16 .000 -68556
.10160 -90094 -47017
Weight
Equal
variances not
-6.748 10.807 .000
-68556
10160
-.90966 -46145
assumed
Table 2. T-test for Dependent Samples from a sample study
Paired Samples Test
Paired Differences
df
Sig. (2-
Mean
Std.
Std. Error
tailed)
Deviation
Mean
Pair 1
Treatment
- Weight
-.07278
26437
95% Confidence
Interval of the
Difference
Lower
06231-20425
Upper
05869-168
17
259
Expert Solution
This question has been solved!
Explore an expertly crafted, step-by-step solution for a thorough understanding of key concepts.

Step by step
Solved in 2 steps

Recommended textbooks for you
College Algebra (MindTap Course List)
Algebra
ISBN:
9781305652231
Author:
R. David Gustafson, Jeff Hughes
Publisher:
Cengage Learning

Glencoe Algebra 1, Student Edition, 9780079039897…
Algebra
ISBN:
9780079039897
Author:
Carter
Publisher:
McGraw Hill
College Algebra (MindTap Course List)
Algebra
ISBN:
9781305652231
Author:
R. David Gustafson, Jeff Hughes
Publisher:
Cengage Learning
Glencoe Algebra 1, Student Edition, 9780079039897…
Algebra
ISBN:
9780079039897
Author:
Carter
Publisher:
McGraw Hill