2. Compute the mean and median. 3. Compute the first and third quartiles. 4. Compute the variance and standard deviation.
Q: Stay in school: In a recent school year in the state of Washington, there were 316,000 high school…
A: There were 316000 high school students.Among the girls, 48300 dropped out of school.Among the boys,…
Q: In a recent awards ceremony the age of the winner for the best actor award was 34 and the age of the…
A:
Q: Hi there, could you please provide the formulas for the above decision entries?
A: The mathematical expectation represents the average value or…
Q: 4. Suppose X₁, X₁, X₂,... are iid Binomial (2,3). If we view this sequence as a Markov chain with S=…
A: are iid Binomial (2, 1/2). This is a Markov chain with . The PTM is the Probability Transition…
Q: The following data show the results of two random samples that measured the average number of…
A: a)We can reasonably assume that each population has normal distribution because sampled data do not…
Q: A researcher looking for evidence of extrasensory perception (ESP) tests 1000 subjects. Forty-three…
A: In the quest to explore the possibility of extrasensory perception (ESP), a researcher conducted a…
Q: A paper reported that for a group of 76 college students, the average number of responses changed…
A: here z score for 0 =(X-mean)/standard deviation =(0-0.9)/1 =-0.9please try 0.9 in place of (-0.9)…
Q: You wish to test the following claim (H₂) at a significance level of a = 0.001. H₂: P₁ = P₂ H₂: Pi…
A: The information provided in the question are as follows :-Significance level Proportion of success…
Q: The International League of Triple-A minor league baseball consists of 14 teams organized into three…
A: AttendanceNorthSouthWest88104554782484976966855091186291916369344426823471375764
Q: a) What is the probability P(X 101.5)? c) What is the probability P(99.3 < X < 100.5)?
A: Given that population mean =100Population standard deviation = 15Sample size = 900
Q: Please answer the following questions using the decision tree: posting again because the last…
A: The decision tree helps us in taking decisions according to the given conditions. In the decision…
Q: It seems these days that college graduates who are employed full-time are working more hours than…
A: Construct the frequency distribution table using the given data.Number of hours worked per…
Q: 1. Suppose a researcher goes to a small college of 200 faculty,12 of which have blood type O-…
A: Population size N=200Number of faculty members who have blood type-O negative in the population is…
Q: ost adults would not erase all of their personal information online if they could. A software firm…
A: Sample size, % of people that would erase all the information online if it occurred is 5%
Q: The lengths of lumber a machine cuts are normally distributed with a mean of 92 inches and a…
A: Mean()=92standard deviation()=0.5
Q: In one region, the September energy consumption levels for single-family homes are found to be…
A: Mean()=1050standard deviation()=218
Q: | Make a box-and-whisker plot of the data. Find the interquartile range. 8. | Health Care: Staff…
A: Here. We want solution for question 8To calculate the mean and standard deviation of the given data,…
Q: 2. Given a two-factor factorial experiment and the ANOVA summary table that follows, fill in all the…
A: FB=11, MSB=55
Q: The ages (in years) of a random sample of shoppers at a gaming store are shown. Determine the range,…
A: Given data refers the sample data of ages of randomly selected shoppers at a gaming store. The…
Q: You are concerned that nausea may be a side effect of Tamiflu, but you cannot just give Tamiflu to…
A: From the provided information,Sample size (n) = 2371From which 841 experienced nausea.Sample…
Q: le covariance is an unbiased estimator of Cov(X₁, Y₁). equality X₁ X = (Xi − µ) — (X − µμ). - - - om…
A: Step 1: proove part (a)a)Recall that the sample covariance between X and Y is defined as:Cov(X,Y) =…
Q: A teacher would like to determine if quiz scores improve after completion of a worksheet. The…
A: Null Hypothesis Alternative Hypothesis (claim)Significance level Sample data:…
Q: will interpret all of that information. You will also compare the power analysis results and the…
A: Research Question: Does the new teaching method lead to significantly higher test scores compared to…
Q: On the midnight shift, the number of patients with head trauma in an emergency room has the…
A: A probability distribution's Mean depicts the distribution's central tendency. The weights used to…
Q: Consider two data sets A and B. The sets are identical except the high value of data set B is three…
A: It is given that-We have two datasets A and B which are identical except the maximum value of B is…
Q: K represent the weights of various cars and their gas mileages. Complete parts (a) through (d). on…
A: The data is given as-CarsWeight(pound)Miles per GallonA317522B359018C300022D356520E258027
Q: Scenario: Suppose a financial institution holds a well diversified $35,500,000 position in stocks.…
A: In this question, we are given a financial institution's diversified position in stocks, the…
Q: Paired t-Test In the last few years, a number of web-based companies that offer job-placement…
A: FinanceMarketing780007500085000790007500079000780007600074000790007900076000860008000084000710007600…
Q: We determined the sum of the squared deviations to be Σ(x − x)2 = 21,912.1, and there are n = 10…
A: The sum of the squared deviations is=21912.1n=10
Q: The ages of Hampton's five cousins are listed below. 15 | 20 | 5 | 13 | 16 | 1) Calculate the mean.…
A: A measure of central tendency that represents the average value of a set of numbers is termed…
Q: Z is a normally distributed variable with mean μ = 0 and standard deviation σ = 1. Find P(-1 < z <…
A: a normally distributed variable with mean μ = 0 and standard deviation σ =…
Q: Find the mean, median, and mode of the data, if possible. If any of these measures cannot be found…
A: From the provided information,The data values are as follow:65, 53, 38, 45, 65, 24, 119, 15, 119, 85
Q: termine whether each pair of actions results in independent or dependent events. Pick one marble out…
A: Dependent and independent events in statistics relate to the link between two or more occurrences…
Q: Find the probability of selecting the letter "s" from the word "succession" O 0.5 0.3 01 O 0.2
A: " SUCCESSION "Number of letters in the given word =10Number of times letter ' S' occur =3
Q: Please solve f and g.
A: The regression equation is given. Part (g) is not given. We solve d, e and f.
Q: Determine if the outcome is unusual. Consider as unusual any result that differs from the mean by…
A: A recent coffee consumption study showed that among 1253 randomly selected subjects, 80% of them…
Q: A6 Assume that least squares regression is used to fit a regression line y = â + 3x to data (xi, yi)…
A: We convert the given expressions into the general expressions used in mutiple regression
Q: The Center for Medicare and Medical Services reported that there were 295,000 appeals for…
A: Hey there! Thank you for posting the question. Since your question has more than 3 parts, we are…
Q: You wish to test the following claim (Ha) at a significance level of a = 0.05. Ho : μ = 88.3…
A: Sample size (n) = 119Sample mean (M) = 84.4Sample standard deviation (SD) = 14.1Level of…
Q: Determine if the outcome is unusual. Consider as unusual any result that differs from the mean by…
A: Sample size 80% of them drank coffee every day.Number of coffee drinkers out of 1253 subjects is…
Q: Sample median is an unbiased estimator. False O True
A: One of the measures of central tendency is the median.
Q: Find the probability of the z-scores between -2.61 and 2.33. O 0.0045 O 0.9901 O 0.11 O 0.9856
A: Required probability is P(-2.61<Z<2.33)
Q: The number of traffic accidents at a certain intersection is thought to be well modeled by a Poisson…
A: Solution:- To find the probability that less than three months elapse between accidents in a Poisson…
Q: Beer and blood alcohol content: Many people believe that gender, weight, drinking habits, and many…
A: The provided scatter plot indicates the relationship between the cans of beer (defined on the…
Q: Is the boxplot skewed and does it have any outliers
A: Box plot : Box plot consist 5 number summary : { Minimum,Q1,Q2,Q3, Maximum } GenerallyOutliers…
Q: "Trydint" bubble-gum company claims that 9 out of 10 people prefer their gum to "Eklypse". Test…
A: Hello! Thanks for the question. We are answering the first 3 sub parts in the case of multiple…
Q: Complete the following probability table. (Round Prior Probability and Posterior Probability answers…
A: The prior probability, The conditional probabilities are: and
Q: Out of 500 people sampled, 150 had kids. Based on this, construct a 99% confidence interval for the…
A: To construct a 99% confidence interval for the true population proportion of people with kids, we…
Q: In a study, the sample is chosen by writing everyone's name on a playing card, shuffling the deck,…
A: The sample is the subset of the population using equal proportions. Here, the sample has been taken…
Q: Using a 0.01 level of significance, test the claim that the diet is not effective in reducing weight…
A: Let be the population mean difference between before and after measurement.The data is given on the…
Please do not give solution in image format thanku
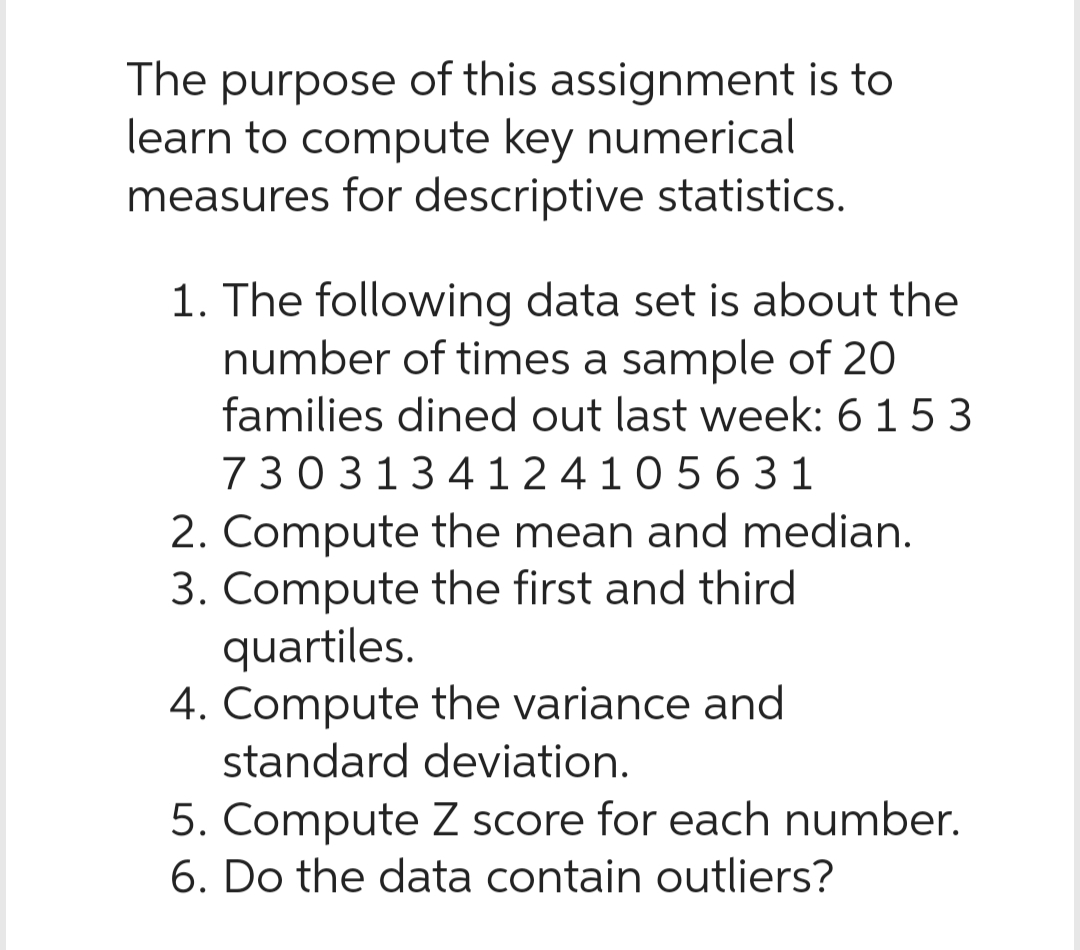
Step by step
Solved in 5 steps with 6 images