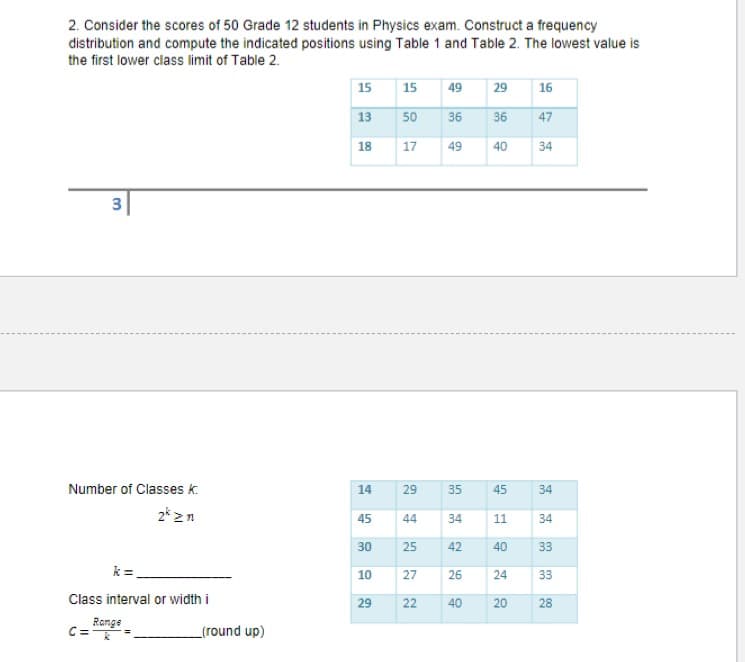
2. Consider the scores of 50 Grade 12 students in Physics exam. Construct a frequency distribution and compute the indicated positions using Table 1 and Table 2. The lowest value is the first lower class limit of Table 2. 15 15 49 29 16 13 50 36 36 47 18 17 49 40 34 Number of Classes k: 14 29 35 45 34 2* 2n 45 44 34 11 34 30 25 42 40 33 k = 10 27 26 24 33 Class interval or width i 29 22 40 20 28 Range C= (round up)


Q: 3. Find A.M. from the following frequency distribution. Wages No. of workers 100 120 140 160 180 200…
A:
Q: Consider the following frequency table representing the distribution of hours students study for an…
A: Steps to find class boundaries : 1) Subtract the upper class limit for the first class from the…
Q: Refer to the accompanying data set and use the 30 screw lengths to construct a frequency…
A: We have been given the 30 screw lengths. The frequency distribution starting with 3.220 in and using…
Q: For items a - j, refer to this) 1. A marketing research consultant conducted a survey of 40 persons…
A:
Q: The following data give the amounts spent on video rentals (in dollars) during 2020 by 20 households…
A: The histogram is a plot which is used to depict the distribution of data with frequency on vertical…
Q: The Whitcomb Company manufactures a metal ring for industrial engines that usually weighs about 50…
A: 1) The size of each class into which a variable's range is divided is defined as the class…
Q: The number of customers at 5:00 pm at different restaurants around Anderson. 77 89 37 89 78 54 38 89…
A: Solution: The highest value in the data set is 115 H = 115 The lowest value in the data set is 22 L…
Q: Consider the following frequency table representing the scores on a test. Scores on a Test Class…
A: Given, The class frequency table We need to determine the lower class boundary for the second…
Q: III. The Department of Agriculture obtained the following data representing the one week growth in…
A: Since you have posted a question with multiple sub-parts, we will solve first three subparts for…
Q: II. Given are test scores in Statistics of 60 students. 19 44 24 43 33 29 26 25 29 23…
A: The frequency distribution is the presentation of data in a table manner and it displays that how…
Q: 1) A medical research team studied the ages of patients who had strokes caused by stress. The ages…
A: Since you have asked multiple questions, we will solve the first question for you. If you want any…
Q: Here is a data set that has a nearly normal distribution. data data data data 50.9 52.86 44.26…
A:
Q: 1. Using the data below which are the number of kilos of newspapers contributed by one section in…
A: Since you have posted a question with multiple sub-parts, we will solve first three sub-parts for…
Q: 49 55 39 37 44 47 44 32 38 53 46 26 46 46 37 45 39 38 33 48 46 66 48 44 59 45 54 56 41 44 31 53 35…
A: NOTE: As per the guidelines, we are supposed to solve the first three subparts only.a). Ungrouped:…
Q: QUESTION 5 For the given frequency distribution, calculate the mean of X. Class Limit 1-7 8-14 15-21…
A: Given: Class limit Midpoint x Frequency f 1-7 4 8 8-14 11 12 15-21 18 18 22-28 25 12…
Q: 3. The following data give the monthly expenditures (in hundred RM) on food for 30 households…
A: a) Frequency distribution table: Class interval Frequency Mid point x fx cf 0-3 4 1.5 6 4…
Q: The following are the marks of the Statistics subject obtained by 40 students in a final…
A:
Q: Refer to the accompanying data set and use the 30 screw lengths to construct a frequency…
A: Selection of number of classes: The “2 to the k rule” suggests that the number of classes is the…
Q: Here is a data set that has a nearly normal distribution. data data data data 61.77 55.7 50.27…
A: Given data is…
Q: Use the given frequency distribution to find the (a) class width. (b) class midpoint of the first…
A: Frequency distribution: In statistics, a frequency distribution is a list, a table that contains the…
Q: A city council is interested in the number of houses in each street of a suburb, because it intends…
A: a)For the given and given class interval, the frequency distribution table is- Class Interval…
Q: Based on the above results, prepare a frequency distribution. Intervals Frequency $ 0 – $…
A: Given observation : 5.46 20.36 17.66 14.05 8.35 7.91 22.81 20.11 9.15…
Q: A. Consider the following problem. A class of 50 students took a 80-item test and their scores are…
A: Solution
Q: 1. The table below lists the ages of the U.S. president at their inauguration. 57 61 57 57 57 61 50…
A: Note : We’ll answer the first question since the exact one wasn’t specified. Please submit a new…
Q: 3. A manager at Sobeys is interested in the distance Sobeys employees travel to work each day. She…
A: Given: 1 2 6 7 12 13 2 6 9 5 18 7 3 15 15 4 17 1 14 5 4…
Q: Construct a frequency distribution using four classes and show ONLY Class limits and Frequencies.
A: Frequency distribution table is a type of table which displays the various outcomes of a sample.…
Q: II. Suppose the following are the electric energy consumption of 50 households in a locality. Make a…
A: Number of times a variate value is repeated is called a frequency. For the Given data we need to…
Q: The number of unclaimed expired prizes (in millions of dollars) for lottery tickets bought in a…
A: Given information: The number of unclaimed expired prizes (in millions of dollars) for lottery…
Q: Using the data below which are the number of kilos of newspapers contributed by one section in the…
A: a. The frequency distribution for the give 40 observations is given below : Excel is used for the…
Q: e to construct a frequency distribution with a first class (in millions) of 0-99. Copies Sold…
A: In this question, concept of frequency distribution is applied. Frequency Distribution A frequency…
Q: frequency distribution with
A: Given that Data for frequency distribution Total number of data values (n) = 30 Arrange the data in…
Q: The following is a frequency distribution for the number of cars sold by each salesman working at a…
A:
Q: Make frequency distribution using 5 classes and find the following: Coefficient of Skewness
A:
Q: Consider the following frequency table representing the distribution of hours students study for an…
A:
Q: 1. The following data give the number of text messages sent to 24 randomly selected days in 2019 by…
A: Hello, since your question has multiple sub-parts, we will solve the first three sub-parts for you.…
Q: Consider the grouped frequency distribution below, in which the speed (in km/hr) of 40 cars are…
A: Find mode
Q: Construct a frequency distribution table and Show solution. Compute the following: a. Class…
A:
Q: Consider the following data set. The annual wages of employees at a small accounting firm are given…
A: We have find frequency.
Q: Here is a data set that has a nearly normal distribution. data data data data 43.04 50.68 48.67 33.8…
A: According to the provided information, a data set has been given
Q: Using the data below which are the number of kilos of news contributed by one section in the…
A: Given data represents the number of kilos of newspapers contributed by one section in the Newspaper…
Q: 1.hoose the correct class width for the frequency distribution. Number in attendance at school…
A: To find : class width for the frequency distribution Number in attendance at school clubs…
Q: 2. The WacbesaK Outpatient Center, designed for same-day minor surgery, opened last month. Following…
A: Given: Sample size, n = 16, maximum = 31 & minimum = 25 therefore, range = max - min…
Q: Following figures give the ages in years of newly married husbands anl ues Represent the data hy a…
A:
Q: 30. FILE The following data give the weekly amounts spent on groceries for a sample of 45…
A: n =45 Arrange the data in non descending order.
Q: Consider the grouped frequency distribution below, in which the speed (in km/hr) of 40 cars are…
A: We want to tell you which one is the correct choice.
Q: Calculate the class width of this data and construct a frequency distribution for this data set…
A: The objective is to calculate the class width of data and construct a frequency distribution for…
Q: 30. The following data give the weekly amounts spent on groceries for a sample of households. df…
A:
Q: Refer to the accompanying data set and use the 30 screw lengths to construct a frequency…
A: Given : Screw lengths (Inches) 2.977 3.002 2.991 2.979 2.982 2.991 3.004 2.978 3.002 3.009…
Q: The data below shows time taken (in minutes) for 50 students to travel to their school from home.…
A: Frequency: In statistics, the frequency of an event A is the number n(A) of times the…


Trending now
This is a popular solution!

Step by step
Solved in 3 steps

- Refer to the accompanying data set and use the 30 screw lengths to construct a frequency distribution. Begin with a lower class limit of 2.2202.220 in., and use a class width of 0.010 in. The screws were labeled as having a length of 2 1 divided by 4 in.2 1/4 in. 2.226 2.257 2.262 2.266 2.236 2.243 2.242 2.228 2.258 2.253 2.257 2.248 2.243 2.236 2.259 2.259 2.268 2.257 2.247 2.267 2.246 2.266 2.255 2.251 2.268 2.233 2.254 2.264 2.257 2.241The following data give the numbers of orders received for a sample of 30 items at the Time-saver Mail Order Company.34 44 31 52 41 47 38 35 32 3928 24 46 41 49 53 57 33 27 3730 27 45 38 34 46 36 30 47 50Using 6 classes of equal width, construct a grouped frequency distribution of the above data. Let 22 be thelower limit of the initial class. 1.1 Calculate the mid-70% range. 1.1.2 Calculate the coefficient of variation and interpret the value obtained. Class interval Frequency (f) Midpoint (x) Cumulative Frequency (CF) fx fx² 22 < 28 28 < 34 34 < 40 40 < 46 46 < 52 52 < 58 ∑f ∑ =2.3 The National Safety Council reports the following age breakdown for licensed drivers in the United States. Source: Bureau of the Census, Statistical Abstract of the United States 2009, p. 682. Age (Years) Licensed Drivers (Millions) Under 20 10.72 20–under 25 16.84 25–under 35 40.78 35–under 45 45.59 45–under 55 36.70 55–under 65 23.32 65 or over 28.76 Identify the following for the 35–under 45 classes: (a) Frequency (b) upper and lower limits (c) width and (d) midpoint.
- The following data give the hourly wage rates (Rands) for a sample of 20 workers selected from a largecompany.12.50 9.45 13.85 7.25 8.70 14.60 11.75 14.50 10.80 12.457.50 15.90 9.75 11.50 13.30 6.25 15.50 12.80 5.35 9.50 (v) Determine the mean wage rate using the raw data. (iv) Group the data into a frequency distribution with a lowest class lower limit of R 5.00 and a classwidth of R 2.00.The following is the data set for specific research regarding a certain product 15 19 14 20 13 23 16 25 17 12 20 11 23 10 14 11 25 12 11 15 8 17 8 18 16 19 17 19 24 What is the range of the data set? How many class intervals should be constructed? How many elements does the class width has? What is the frequency of the class interval with the highest value? What is the >cf of the 3rd to the highest class interval?The following data represents the GPA of a sample of 15 students enrolled in a math class. Use technology and round to 4 decimal places. GPA 3.01 3.96 3.46 1.52 1.75 2.89 2.77 1.66 2.27 3.2 2.28 2.29 1.96 1.71 2.07 (g) Find the interquartile range. (h) What are the lower and upper limits to find outliers? LL: UL: (i) Find s2.
- Use this frequency distribution table to calculate the following: 1.Coefficient of variation 2.Geometric mean 3.Measure of skewness Interval (cm) frequency Cum more than frequency Cum less than frequency Class midpoint F.M Frequency percentage % 40≤49 3 3 30 44.5 133.5 10 50≤59 9 12 27 54.5 490.5 30 60≤69 10 22 18 64.5 645 33.3 70≤79 5 27 8 74.5 372.5 16.67 80≤89 2 29 3 84.5 169 6.67 90≤99 1 30 1 94.5 94.5 3.33 TOTALS 30 1905 100The amount of money spent on a week’s holiday by 40 students, correct to the nearest £10, is shown below 180 190 170 210 190 160 210 180 240 130 190 150 200 210 160 200 180 130 210 180 200 190 220 170 230 270 180 220 200 210 140 210 150 200 210 190 200 170 210 180 (a) Group the data into classes of width £20 starting with 120-139, 140-159 and so on. (b) What is the modal class? (c) Using the grouped frequency distribution you found in part (a), estimate the mean and standard deviation of the data.The following table displays a relative frequency distribution for the number of siblings for students in a school. For a randomly selected student in the school, let X denote the number of siblings of the student. Number of Siblings Relative Frequency 0 0.1140 1 0.1420 2 0.7010 3 0.0210 4 0.0120 5 0.0065 6 0.0025 7 0.0010 P (X < 3) = ____________ P (X = 4) = ____________
- The following data provide the monthly electricity bills of a sample of households in Cavite: 1084 1452 764 1348 1180 1276 1000 1212 928 650 708 796 1064 1116 820 1116 768 724 1284 1236 984 1112 355 300 1340 1280 752 1188 1896 960 1716 1176 2280 1368 1116 1234 890 2500 2459 2568 Determine the range, class size and class interval. Construct a frequency distribution table. Compute for mean, median and mode.Following are the measurement of 40 equipment:2.0 2.5 2.3 2.8 4.5 3.2 3.5 2.2 1.5 4.55.5 6.5 3.2 4.5 3.4 4.1 3.4 3.3 5.6 1.94.6 9.7 6.5 2.8 3.1 7.2 6.8 5.1 4.9 2.48.4 7.6 7.9 2.9 3.5 3.1 8.8 7.2 7.8 2.9Construct a frequency distribution using 5 class intervals of equal size. Also find class boundaries,class marks, and cumulative relative frequencies both “less than” and “more thanThe following measurements are recorded as propagation delay of a certain transmission tower located at Manila and a receiver located at Cebu. 15.378 17.625 18.013 18.419 19.020 19.041 30.001 Name any outliers from the data.