2. Create a line graph of the data. 3. Create a 3-year moving average. 4. Plot the graph of the 3-year moving average in the line graph you created in (2). 5. Create a linear trend equation for your data and interpret.
2. Create a line graph of the data. 3. Create a 3-year moving average. 4. Plot the graph of the 3-year moving average in the line graph you created in (2). 5. Create a linear trend equation for your data and interpret.

Chapter8: Sequences, Series,and Probability
Section8.6: Counting Principles
Problem 29E

Related questions
Question
[Please answer immediately. I only have 30 mins] PLEASE PROVIDE THE CORRECT AND SOLUTION. (kindly provide complete and full solution. i won't like your solution if it is incomplete or not clear enough to read.)
* refer to the chart below and answer/provide the following*
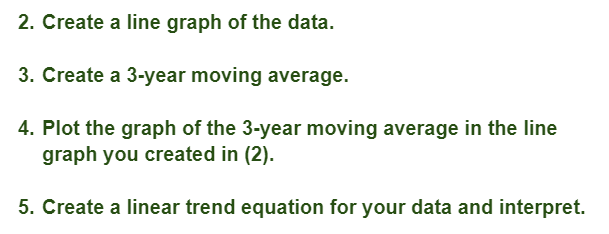
Transcribed Image Text:2. Create a line graph of the data.
3. Create a 3-year moving average.
4. Plot the graph of the 3-year moving average in the line
graph you created in (2).
5. Create a linear trend equation for your data and interpret.
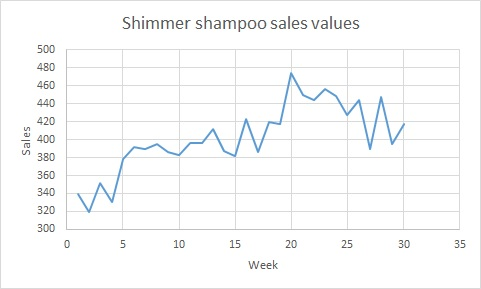
Transcribed Image Text:Sales
500
480
460
440
420
400
380
360
340
320
300
0
Shimmer shampoo sales values
W
15
5
10
Week
20
W
30
25
35
Expert Solution
This question has been solved!
Explore an expertly crafted, step-by-step solution for a thorough understanding of key concepts.

Step by step
Solved in 4 steps with 2 images

Recommended textbooks for you

Glencoe Algebra 1, Student Edition, 9780079039897…
Algebra
ISBN:
9780079039897
Author:
Carter
Publisher:
McGraw Hill

Intermediate Algebra
Algebra
ISBN:
9781285195728
Author:
Jerome E. Kaufmann, Karen L. Schwitters
Publisher:
Cengage Learning
Glencoe Algebra 1, Student Edition, 9780079039897…
Algebra
ISBN:
9780079039897
Author:
Carter
Publisher:
McGraw Hill
Intermediate Algebra
Algebra
ISBN:
9781285195728
Author:
Jerome E. Kaufmann, Karen L. Schwitters
Publisher:
Cengage Learning

Holt Mcdougal Larson Pre-algebra: Student Edition…
Algebra
ISBN:
9780547587776
Author:
HOLT MCDOUGAL
Publisher:
HOLT MCDOUGAL

College Algebra (MindTap Course List)
Algebra
ISBN:
9781305652231
Author:
R. David Gustafson, Jeff Hughes
Publisher:
Cengage Learning

Algebra & Trigonometry with Analytic Geometry
Algebra
ISBN:
9781133382119
Author:
Swokowski
Publisher:
Cengage