Assignment 10 In a study of the development of low birth weight (LBW) infants, newborns were placed into three groups determined by their mother's participation in a special training program about the special needs of low birth weight infants. The mothers were interviewed when the babies were 6 months old to analyze how well they were adapting to their role as a mother. The three groups are: 1. LBW – Experimental; this group of mothers had babies with low birth weights and participated in the special training program 2. LBW – Control; this group of mothers had babies with low birth weights and did not participate in the special training program 3. Full term – Control; this group of mothers had babies born at full term with an average birth weight and did not participate in the special training program The experiment hoped to show that mothers who had participated in the special training program would adapt to their new role as well as the mothers of full-term infants. The experiment expected that mothers with low birth weight infants who did not participate in the training would have more trouble adapting. The data from this training is in the attached file labeled "Assignment 10 Data". This data and this scenario are taken from: Howell, D. C. (2014). Fundamental Statistics for the Behavioral Sciences. Cengage Learning. 1. Run an ANOVA using this data set. Upload an image of your output. (You will probably need to take two screenshots, one for the Description and ANOVA tables and a second for the Tukey HSD tables. 2. What is the confidence interval for the LBW – Control group, and what does it represent? 3. What is the decision for the null hypothesis? 4. What type of error (Type l or Type II) do you risk incurring with the decision that you made in #3? 5. What is the eta-squared value, and what does it mean/how do you interpret it? 6. In the post hoc tests (the Tukey HSD), which individual groups had significant differences? 7. What is the Cohen's d effect size between the Group 1 LBW – Experimental and Group 2 LBW – Control group, and what does it mean/how do you interpret it?
Assignment 10 In a study of the development of low birth weight (LBW) infants, newborns were placed into three groups determined by their mother's participation in a special training program about the special needs of low birth weight infants. The mothers were interviewed when the babies were 6 months old to analyze how well they were adapting to their role as a mother. The three groups are: 1. LBW – Experimental; this group of mothers had babies with low birth weights and participated in the special training program 2. LBW – Control; this group of mothers had babies with low birth weights and did not participate in the special training program 3. Full term – Control; this group of mothers had babies born at full term with an average birth weight and did not participate in the special training program The experiment hoped to show that mothers who had participated in the special training program would adapt to their new role as well as the mothers of full-term infants. The experiment expected that mothers with low birth weight infants who did not participate in the training would have more trouble adapting. The data from this training is in the attached file labeled "Assignment 10 Data". This data and this scenario are taken from: Howell, D. C. (2014). Fundamental Statistics for the Behavioral Sciences. Cengage Learning. 1. Run an ANOVA using this data set. Upload an image of your output. (You will probably need to take two screenshots, one for the Description and ANOVA tables and a second for the Tukey HSD tables. 2. What is the confidence interval for the LBW – Control group, and what does it represent? 3. What is the decision for the null hypothesis? 4. What type of error (Type l or Type II) do you risk incurring with the decision that you made in #3? 5. What is the eta-squared value, and what does it mean/how do you interpret it? 6. In the post hoc tests (the Tukey HSD), which individual groups had significant differences? 7. What is the Cohen's d effect size between the Group 1 LBW – Experimental and Group 2 LBW – Control group, and what does it mean/how do you interpret it?

Chapter6: Systems Of Equations And Inequalities
Section: Chapter Questions
Problem 17PS: Cholesterol Cholesterol in human blood is necessary, but too much can lead to health problems. There...

Related questions
Question
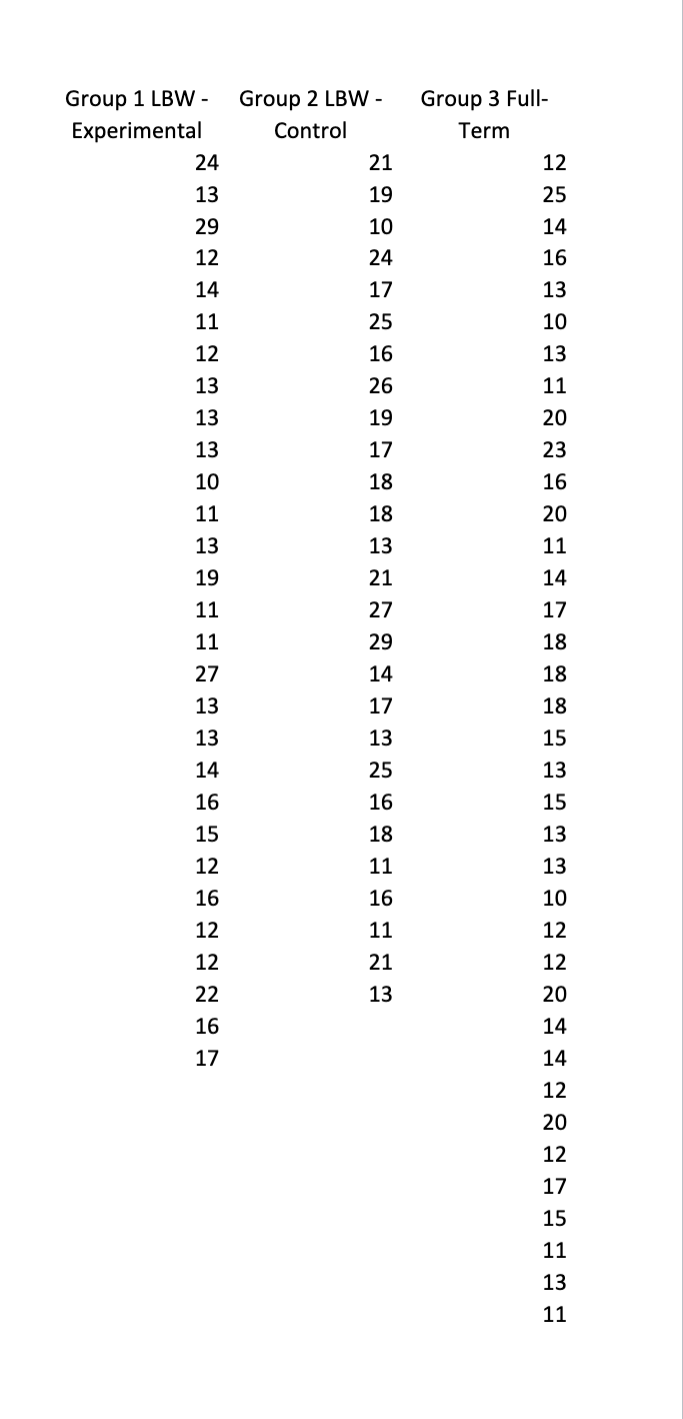
Transcribed Image Text:Group 1 LBW - Group 2 LBW -
Experimental
Control
24
21
13
19
29
10
12
24
14
17
11
25
12
16
13
26
13
19
13
17
10
18
11
18
13
13
19
21
11
27
11
29
14
17
13
25
16
18
11
16
11
21
13
16
27
13
13
14
16
15
12
16
12
12
22
16
17
Group 3 Full-
Term
12
25
14
16
13
10
13
11
20
23
16
20
11
14
17
18
18
18
15
13
15
13
13
10
12
12
20
14
14
12
20
12
17
15
11
13
11

Transcribed Image Text:Assignment 10
In a study of the development of low birth weight (LBW) infants, newborns were placed into
three groups determined by their mother's participation in a special training program about the
special needs of low birth weight infants. The mothers were interviewed when the babies were
6 months old to analyze how well they were adapting to their role as a mother.
The three groups are:
1. LBW - Experimental; this group of mothers had babies with low birth weights and
participated in the special training program
2. LBW-Control; this group of mothers had babies with low birth weights and did not
participate in the special training program
3.
Full term - Control; this group of mothers had babies born at full term with an
average birth weight and did not participate in the special training program
The experiment hoped to show that mothers who had participated in the special training
program would adapt to their new role as well as the mothers of full-term infants. The
experiment expected that mothers with low birth weight infants who did not participate in the
training would have more trouble adapting.
The data from this training is in the attached file labeled "Assignment 10 Data". This data and
this scenario are taken from:
Howell, D. C. (2014). Fundamental Statistics for the Behavioral Sciences. Cengage Learning.
1. Run an ANOVA using this data set. Upload an image of your output. (You will probably
need to take two screenshots, one for the Description and ANOVA tables and a second for
the Tukey HSD tables.
2. What is the confidence interval for the LBW - Control group, and what does it represent?
3. What is the decision for the null hypothesis?
4. What type of error (Type I or Type II) do you risk incurring with the decision that you made
in #3?
5. What is the eta-squared value, and what does it mean/how do you interpret it?
6.
7.
In the post hoc tests (the Tukey HSD), which individual groups had significant differences?
What is the Cohen's d effect size between the Group 1 LBW - Experimental and Group 2
LBW - Control group, and what does it mean/how do you interpret it?
Expert Solution
This question has been solved!
Explore an expertly crafted, step-by-step solution for a thorough understanding of key concepts.

This is a popular solution!

Trending now
This is a popular solution!

Step by step
Solved in 3 steps with 2 images

Follow-up Questions
Read through expert solutions to related follow-up questions below.
Follow-up Question
What type of error (Type I or Type II) do you risk incurring with the decision that you made in #3?
Solution
Recommended textbooks for you

Linear Algebra: A Modern Introduction
Algebra
ISBN:
9781285463247
Author:
David Poole
Publisher:
Cengage Learning
Linear Algebra: A Modern Introduction
Algebra
ISBN:
9781285463247
Author:
David Poole
Publisher:
Cengage Learning