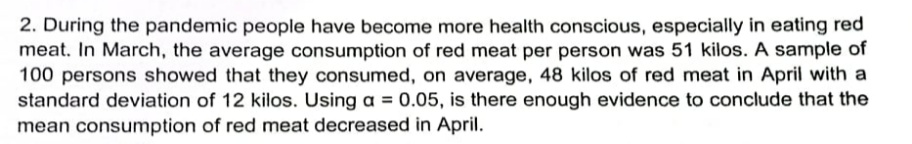
2. During the pandemic people have become more health conscious, especially in eating red meat. In March, the average consumption of red meat per person was 51 kilos. A sample of 100 persons showed that they consumed, on average, 48 kilos of red meat in April with a standard deviation of 12 kilos. Using a = 0.05, is there enough evidence to conclude that the mean consumption of red meat decreased in April.
2. During the pandemic people have become more health conscious, especially in eating red meat. In March, the average consumption of red meat per person was 51 kilos. A sample of 100 persons showed that they consumed, on average, 48 kilos of red meat in April with a standard deviation of 12 kilos. Using a = 0.05, is there enough evidence to conclude that the mean consumption of red meat decreased in April.

MATLAB: An Introduction with Applications
6th Edition
ISBN:9781119256830
Author:Amos Gilat
Publisher:Amos Gilat
Chapter1: Starting With Matlab
Section: Chapter Questions
Problem 1P

Related questions
Question
Transcribed Image Text:2. During the pandemic people have become more health conscious, especially in eating red
meat. In March, the average consumption of red meat per person was 51 kilos. A sample of
100 persons showed that they consumed, on average, 48 kilos of red meat in April with a
standard deviation of 12 kilos. Using a = 0.05, is there enough evidence to conclude that the
mean consumption of red meat decreased in April.
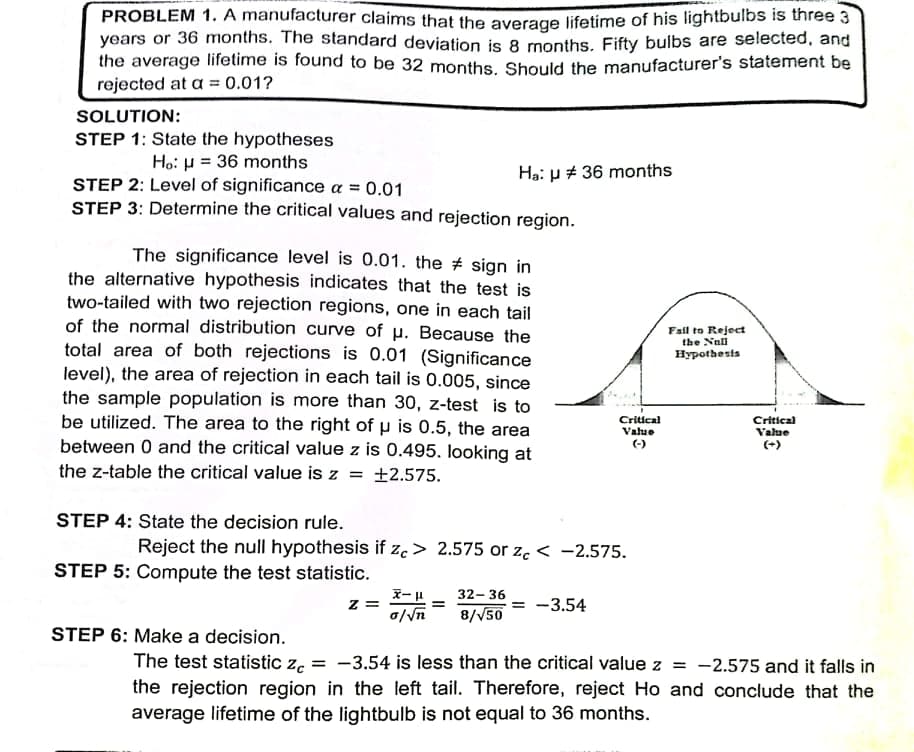
Transcribed Image Text:PROBLEM 1. A manufacturer claims that the average lifetime of his lightbulbs is three 3
years or 36 months. The standard deviation is 8 months. Fifty bulbs are selected, and
the average lifetime is found to be 32 months, Should the manufacturer's statement be
rejected at a = 0.01?
SOLUTION:
STEP 1: State the hypotheses
Ho: H = 36 months
Hạ: p # 36 months
STEP 2: Level of significance a = 0.01
STEP 3: Determine the critical values and rejection region.
The significance level is 0.01. the # sign in
the alternative hypothesis indicates that the test is
two-tailed with two rejection regions, one in each tail
of the normal distribution curve of p. Because the
total area of both rejections is 0.01 (Significance
level), the area of rejection in each tail is 0.005, since
the sample population is more than 30, z-test is to
be utilized. The area to the right of u is 0.5, the area
between 0 and the critical value z is 0.495. looking at
the z-table the critical value is z = ±2.575.
Fall to Reject
the Nall
Hypothesis
Critical
Critical
Value
Value
(-)
(+)
STEP 4: State the decision rule.
Reject the null hypothesis if ze > 2.575 or z. < -2.575.
STEP 5: Compute the test statistic.
32- 36
z =
= -3.54
8/V50
STEP 6: Make a decision.
= -3.54 is less than the critical value z = -2.575 and it falls in
The test statistic ze
the rejection region in the left tail. Therefore, reject Ho and conclude that the
average lifetime of the lightbulb is not equal to 36 months.
Expert Solution
This question has been solved!
Explore an expertly crafted, step-by-step solution for a thorough understanding of key concepts.

Step by step
Solved in 2 steps with 1 images

Recommended textbooks for you
MATLAB: An Introduction with Applications
Statistics
ISBN:
9781119256830
Author:
Amos Gilat
Publisher:
John Wiley & Sons Inc

Probability and Statistics for Engineering and th…
Statistics
ISBN:
9781305251809
Author:
Jay L. Devore
Publisher:
Cengage Learning

Statistics for The Behavioral Sciences (MindTap C…
Statistics
ISBN:
9781305504912
Author:
Frederick J Gravetter, Larry B. Wallnau
Publisher:
Cengage Learning
MATLAB: An Introduction with Applications
Statistics
ISBN:
9781119256830
Author:
Amos Gilat
Publisher:
John Wiley & Sons Inc
Probability and Statistics for Engineering and th…
Statistics
ISBN:
9781305251809
Author:
Jay L. Devore
Publisher:
Cengage Learning
Statistics for The Behavioral Sciences (MindTap C…
Statistics
ISBN:
9781305504912
Author:
Frederick J Gravetter, Larry B. Wallnau
Publisher:
Cengage Learning

Elementary Statistics: Picturing the World (7th E…
Statistics
ISBN:
9780134683416
Author:
Ron Larson, Betsy Farber
Publisher:
PEARSON

The Basic Practice of Statistics
Statistics
ISBN:
9781319042578
Author:
David S. Moore, William I. Notz, Michael A. Fligner
Publisher:
W. H. Freeman

Introduction to the Practice of Statistics
Statistics
ISBN:
9781319013387
Author:
David S. Moore, George P. McCabe, Bruce A. Craig
Publisher:
W. H. Freeman