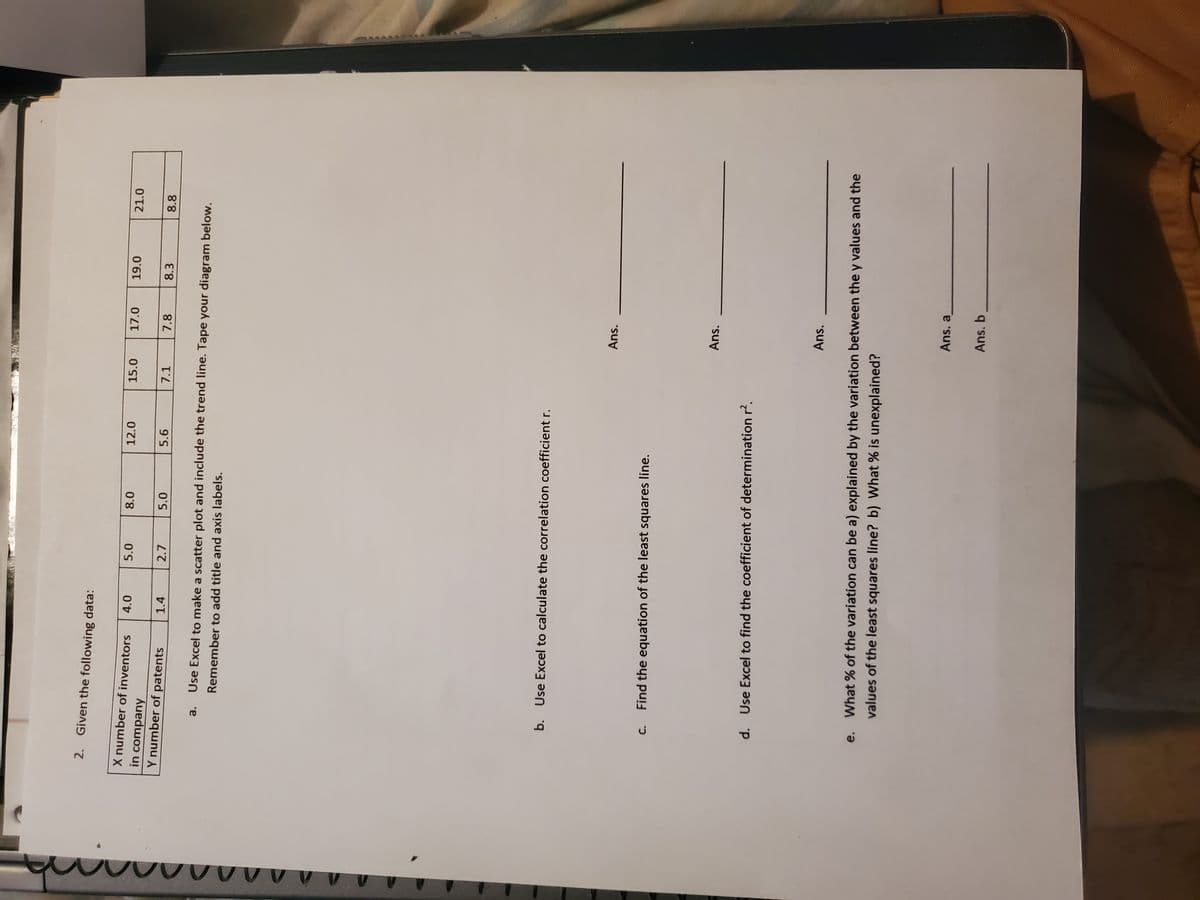
2. Given the following data: X number of inventors in company Y number of patents 12.0 15.0 17.0 21.0 O' 0'8 0'61 O'S 1.4 2.7 5.6 7.1 7.8 8.3 8.8 O'S Use Excel to make a scatter plot and include the trend line. Tape your diagram below. Remember to add title and axis labels. b. Use Excel to calculate the correlation coefficient r. Ans. Find the equation of the least squares line. Ans. d. Use Excel to find the coefficient of determination r. Ans. e. What % of the variation can be a) explained by the variation between the y values and the values of the least squares line? b) What % is unexplained? Ans. a Ans. b


Correlation
Correlation defines a relationship between two independent variables. It tells the degree to which variables move in relation to each other. When two sets of data are related to each other, there is a correlation between them.
Linear Correlation
A correlation is used to determine the relationships between numerical and categorical variables. In other words, it is an indicator of how things are connected to one another. The correlation analysis is the study of how variables are related.
Regression Analysis
Regression analysis is a statistical method in which it estimates the relationship between a dependent variable and one or more independent variable. In simple terms dependent variable is called as outcome variable and independent variable is called as predictors. Regression analysis is one of the methods to find the trends in data. The independent variable used in Regression analysis is named Predictor variable. It offers data of an associated dependent variable regarding a particular outcome.

Step by step
Solved in 2 steps with 5 images


