all

College Algebra (MindTap Course List)
12th Edition
ISBN:9781305652231
Author:R. David Gustafson, Jeff Hughes
Publisher:R. David Gustafson, Jeff Hughes
Chapter8: Sequences, Series, And Probability
Section8.7: Probability
Problem 6E: List the sample space of each experiment. Tossing three coins

Related questions
Question
please solve all
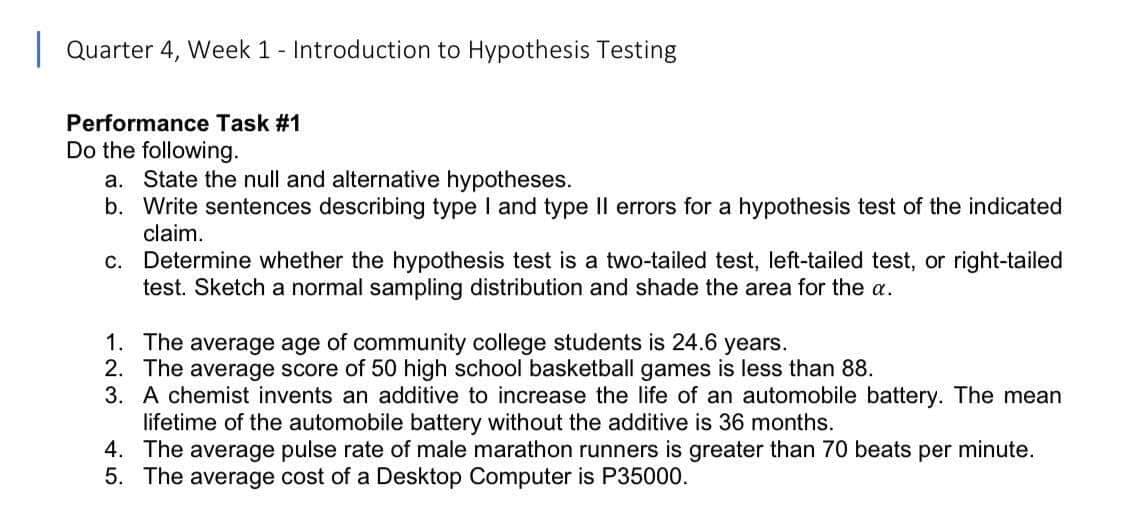
Transcribed Image Text:Quarter 4, Week 1 - Introduction to Hypothesis Testing
Performance Task #1
Do the following.
a. State the null and alternative hypotheses.
b. Write sentences describing type I and type II errors for a hypothesis test of the indicated
claim.
c.
Determine whether the hypothesis test is a two-tailed test, left-tailed test, or right-tailed
test. Sketch a normal sampling distribution and shade the area for the a.
1.
The average age of community college students is 24.6 years.
2. The average score of 50 high school basketball games is less than 88.
3. A chemist invents an additive to increase the life of an automobile battery. The mean
lifetime of the automobile battery without the additive is 36 months.
4. The average pulse rate of male marathon runners is greater than 70 beats per minute.
5. The average cost of a Desktop Computer is P35000.
Expert Solution
This question has been solved!
Explore an expertly crafted, step-by-step solution for a thorough understanding of key concepts.

Step by step
Solved in 5 steps with 5 images

Recommended textbooks for you
College Algebra (MindTap Course List)
Algebra
ISBN:
9781305652231
Author:
R. David Gustafson, Jeff Hughes
Publisher:
Cengage Learning

Holt Mcdougal Larson Pre-algebra: Student Edition…
Algebra
ISBN:
9780547587776
Author:
HOLT MCDOUGAL
Publisher:
HOLT MCDOUGAL
College Algebra (MindTap Course List)
Algebra
ISBN:
9781305652231
Author:
R. David Gustafson, Jeff Hughes
Publisher:
Cengage Learning
Holt Mcdougal Larson Pre-algebra: Student Edition…
Algebra
ISBN:
9780547587776
Author:
HOLT MCDOUGAL
Publisher:
HOLT MCDOUGAL