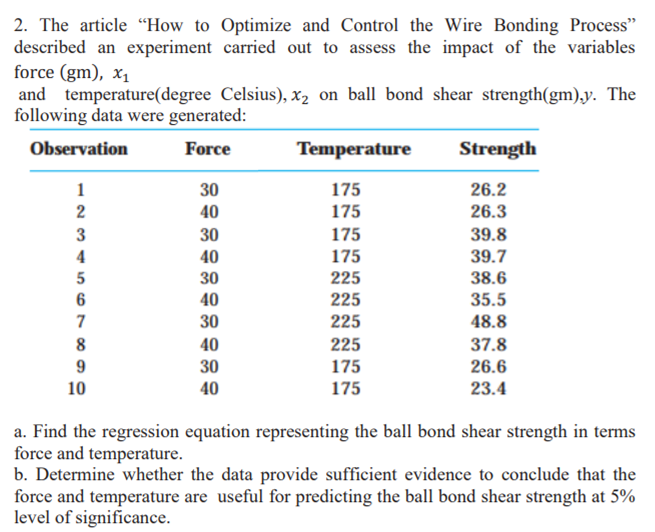
2. The article "How to Optimize and Control the Wire Bonding Process" described an experiment carried out to assess the impact of the variables force (gm), x1 and temperature(degree Celsius), x2 on ball bond shear strength(gm),y. The following data were generated: Observation Force Temperature Strength 1 30 175 26.2 40 175 26.3 30 40 175 39.8 4 175 39.7 5 30 225 38.6 40 35.5 225 225 7 30 48.8 8 40 225 37.8 9 30 175 26.6 10 40 175 23.4 a. Find the regression equation representing the ball bond shear strength in terms force and temperature. b. Determine whether the data provide sufficient evidence to conclude that the force and temperature are useful for predicting the ball bond shear strength at 5% level of significance. 2 3
Q: For this experiment, it is desired to investigate the relationship between air inlet temperature and…
A: Consider the given data that contains the intel temperature (x) and the removal efficiency (y).…
Q: Given data: The following is a list of scores resulting from an English examination administered to…
A: Statistics is the branch of applied Mathematics in which we do collection, analysis, interpretation…
Q: B C D E pop. Serial # Income Food Expenses (Y) Highest Degree Family Size(X) Head of Household…
A: Simple linear Regression: Linear Regression analysis is used to measure the association or linear…
Q: 2. Consider the following manual simulation of machine breakdowns and repair. Time between…
A:
Q: The following data represents a report about the x: carbon amount (in mg per 1g steel) and y: the…
A: Hii ! Thanks for posting the question . Since your question has more than three subparts we have…
Q: A soft drink manufacturer wants to determine the proportion of its soda cans that meet quality…
A: Parameter: Any statistical measure based on all the units in the population is called a Parameter.
Q: 4.5 Consider the multiple regression model fit to the house price data. URIA SEIS FUR EACKLISES 331…
A: Given information: Consider the given data: y x1 x2 x3 x4 x5 x6 x7 x8 x9 25.9 4.9176 1.00…
Q: 1. A study of the potential of acrylonitrile to produce brain tumors in rats was conducted by…
A: Givenstudy of optential of acrylonitrile to produce brain tumors in rats was conducted by…
Q: 2. The authors of the paper "Age, Spacing and Growth Rate of Tamarix as an Indication of Lake…
A: a/b). Given, the data on vigor and stem density. The excel step to obtain the scatter plot for the…
Q: An article in Technometrics (1974, Vol. 16, pp. 523–531) considered the following stack-loss data…
A: Consider the stack loss data from a plant oxidizing ammonia to nitric acid. Twenty one daily…
Q: The table below shows the number of state-registered automatic weapons and the murder rate for…
A: Solution : x = thousands of automatic weaponsy = murders per 100,000 residents data can be modeled…
Q: (b) For the following data- Class 40-50 60-70 70-80 50-60 6. 10-20 20-30 30-40 8 4 Frequency comment…
A:
Q: SITUATION 2 In a certain type of metal test specimen, the normal stress on a specimen is known to be…
A:
Q: For this experiment, it is desired to investigate the relationship between air inlet temperature and…
A: As per guidelines we will solve the first question only, please repost other questions for more…
Q: The payoff table depicting revenues and is shown in the following table. payoffs (PV in millions)…
A: Since you have posted a question with multiple subparts, we will solve first three subparts for you.…
Q: The table below shows the number of state-registered automatic weapons and the murder rate for…
A: Given Information: The table below shows the number of state-registered automatic weapons and the…
Q: TABLE B.2 Solar Thermal Energy Test Data y X₂ 271.8 783.35 33.53 264.0 748.45 36.50 238.8 684.45…
A: Given: y x1 x2 x3 x4 x5 271.8 783.35 33.53 40.55 16.66 13.2 264 748.45 36.5 36.19…
Q: 3.24 An article in the ACI Materials Journal (Vol. 84, 1987, pp. 213–216) describes several…
A: Rodding Level 10 15 20 25 1530 1610 1560 1500 1530 1650 1730 1490 1440 1500 1530…
Q: Consider the following econometric model birthweight = Bo+B₁smoking+u where birthweight is a baby's…
A: Consider the following econometric model birthweight = β0 + β1 smoking + u where birthweight is…
Q: Given a collection of pairs (x, y), find both the correlation coefficient, r, and the regression or…
A: Solution-: We find (a) Correlation (b) Regression line
Q: In the semi-conductor manufacturing plant example, compute for the predicted value (ŷ) of…
A:
Q: A researcher wishes to build an appropriate multiple linear model for predicting response variable Y…
A: Hi! Thank you for the question, As per the honor code, we are allowed to answer three sub-parts at a…
Q: The table below shows the number of state-registered automatic weapons and the murder rate for…
A: Given Y=0.83(x)+4.28
Q: Table for Exercise 12.9 Variable B Estimate Std. Error t-Value Air Quality (x1) Temperature (x2)…
A: There are 6 independent variables. The dependent variable is hotel image. This is multiple…
Q: 6) Consider the following scatterplots of a dependent variable Y against an independent variable X.…
A: Hetersoskedasticity happens when the standard deviation of error term is not constant over different…
Q: State if the following is True or false and provide a brief explanation for your answer. Consider…
A: Hello! As you have posted more than 3 sub parts, we are answering the first 3 sub-parts. In case…
Q: The table below shows the number of state-registered automatic weapons and the murder rate for…
A:
Q: An article in the ACI Materials Journal (Vol. 84, 1987, pp. 213-216) describes several experiments…
A:
Q: An article in the ACI Materials Journal (Vol. 84, 1987, pp. 213-216) describes several experiments…
A: There are 4 independent samples which follows normal distribution. We have to test whether there is…
Q: 5.3.2. The production of a nationally marketed deter- gent results in certain workers receiving…
A: Given Information : The production of a nationally marketed detergent results in certain workers…
Q: Table 4.13 The Relationship Between the Predictors and the Dependent Variable Model Coefficients-…
A: Given: Regression output
Q: 7. A certain raw material is classified as to moisture content X (in percent) and impurity Y (in…
A: "Since you have asked multiple questions, we will solve the first question for you. If you want any…
Q: 5. The following table displays the number of HIV diagnoses per year in a particular country. Year…
A: Consider the year 1997 to be year n=1, similarly the year 1998 will be year n=2, and so on.…
Q: 6. A study was conducted to determine whether a linear relationship exists between the breaking…
A: When we want to estimate an impact of one variable on another variable at that time we use…
Q: The article "Experimental Measurement of Radiative Heat Transfer in Gas-Solid Suspension Flow…
A: Given data and calculation for regression equation is shown below Heat Flux(y) Signal…
Q: Consider the following Model: y = Bo + B₁x₁ + B₂X₂ + ... + BxXx + ε A) With reference to this model,…
A: Since you have posted a question with multiple sub-parts, we will solve first three subparts for…
Q: Table 3 Number 1 2 3 4 5 6 (O 7 Constructs Brand Perception (BP) Perceived After Sales Service…
A: Cronbach's alpha measures the reliability between the dichotomous variable. It is also used for…
Q: An article in the Fire Safety Journal (“The Effect of Nozzle Design on the Stability and Performance…
A: According to the answering guidelines, we can answer only three subparts of a question and the rest…
Q: 4.3 Consider the simple linear regression model fit to the solar energy data. DATA SETS FOR…
A: Given data, simple linear regression fit to the solar energy data. y x1 x2 x3 x4 x5 271.8…
Q: 2.An engineer at a semiconductor company wants to model the relationship between the device HFE (y)…
A: a) Excel Procedure: Enter x1, x2, x3 and y in Excel>Data>Data Analysis>…
Q: An article in the ACI Materials Journal (Vol. 84, 1987, pp. 213-216) describes several experiments…
A: Given :
Q: The article "Lead Dissolution from Lead Smelter Slags Using Magnesium Chloride Solutions" (A.…
A:
Q: Use the Atmospheric Carbon Dioxide Concentration scatterplot below to answer the questions.…
A:
Q: The following table shows demand (x) and supply (v) for a sample of a certain commodity. 12 7 11 19…
A: Hello! As you have posted 2 different questions, we are answering the first question. In case you…
Q: give handwritten answer of the question- Which one of the following is the most used model or…
A:
Q: An article in the ACI Materials Journal (Vol. 84, 1987, pp. 213-216) describes several experiments…
A:
Q: he table below shows the number of state-registered automatic weapons and the murder rate for…
A: Given data, X Y X*Y X*X 11.7 14.2 166.14 136.89 8.6 11.5 98.9 73.96 7.1 10 71 50.41 3.5…
Q: A Nighway department is studying the relationship between traffi fow and speed. The folowng model…
A: Regression analysis is a measure of association between a dependent variable and one or more…
Step by step
Solved in 3 steps with 3 images
- The article “Effect of Varying Solids Concentration and Organic Loading on the Performance of Temperature Phased Anaerobic Digestion Process” (S. Vandenburgh and T. Ellis, Water Environment Research, 2002:142–148) discusses experiments to determine the effect of the solids concentration on the performance of treatment methods for wastewater sludge. In the first experiment, the concentration of solids (in g/L) was 43.94 ± 1.18. In the second experiment, which was independent of the first, the concentration was 48.66 ± 1.76. Estimate the difference in the concentration between the two experiments, and find the uncertainty in the estimate.5. A consumer buying cooperative tested the effective heating area of 20 different electric space heaters with different wattages. Here are the results. Heater Wattage Area 1 750 291 2 1,750 83 3 1,250 215 4 1,750 209 5 1,500 295 6 750 153 7 1,000 40 8 750 166 9 1,250 115 10 1,250 146 11 750 113 12 1,000 56 13 1,750 284 14 1,000 45 15 750 82 16 1,250 175 17 750 150 18 1,500 231 19 1,000 87 20 750 52 Click here for the Excel Data FileRequired:a. Compute the correlation between the wattage and heating area. Is there a direct or an indirect relationship? (Round your answer to 4 decimal places.) b. Conduct a test of hypothesis to determine if it is reasonable that the coefficient is greater than zero. Use the 0.050 significance level. (Round intermediate calculations and final answer to 3 decimal places.)H0: ρ ≤ 0; H1: ρ > 0 Reject H0 if t > 1.734…A consumer buying cooperative tested the effective heating area of 20 different electric space heaters with different wattages. Here are the results. Heater Wattage Area 1 1,000 290 2 750 292 3 1,500 148 4 1,250 246 5 1,250 203 6 750 85 7 1,250 237 8 1,000 139 9 1,500 64 10 1,000 171 11 1,750 163 12 1,250 175 13 750 264 14 1,500 50 15 1,750 163 16 1,500 177 17 1,250 118 18 1,750 122 19 1,000 144 20 1,500 103 Click here for the Excel Data File Compute the correlation between the wattage and heating area. Is there a direct or an indirect relationship? (Round your answer to 4 decimal places.) Conduct a test of hypothesis to determine if it is reasonable that the coefficient is greater than zero. Use the 0.025 significance level. (Round intermediate calculations and final answer to 3 decimal places.) H0: ρ ≤ 0; H1: ρ > 0 Reject H0 if t…
- An investigation was conducted into the dust content in the flue gases of two types of solid-fuel boilers. Thirteen boilers of type A and nine boilers of type B were used under identical fueling and extraction conditions. Over a similar period, the quantities of dust were deposited in similar traps inserted in each of the twenty-two flues. Presented below are the collected dust content (in grams) given the source broiler type. Type A 73.1 56.4 82.1 67.2 78.7 75.1 48.0 53.3 55.5 61.5 60.6 55.2 63.1 Type B 53.0 39.3 55.8 58.8 41.2 66.6 46.0 56.4 58.9 questions are in inserted imagePCBs and Pelicans. Polychlorinated biphenyls (PCBs), industrial pollutants, are known to be carcinogens and a great danger to natural ecosystems. As a result of several studies, PCB production was banned in the United States in 1979 and by the Stockholm Convention on Persistent Organic Pollutants in 2001. One study, published in 1972 by R. Risebrough, is titled “Effects of Environmental Pollutants Upon Animals Other Than Man” (Proceedings of the 6th Berkeley Symposium on Mathematics and Statistics, VI, University of California Press, pp. 443–463). In that study, 60 Anacapa pelican eggs were collected and measured for their shell thickness, in millimeters (mm), and concentration of PCBs, in parts per million (ppm). The data are on the WeissStats site. a. obtain and interpret the standard error of the estimate. b. obtain a residual plot and a normal probability plot of the residuals. c. decide whether you can reasonably consider Assumptions 1–3 for regression inferences met by the two…A consumer buying cooperative tested the effective heating area of 20 different electric space heaters with different wattages. Here are the results. Heater Wattage Area 1 1,000 108 2 750 291 3 1,500 100 4 1,000 43 5 1,250 68 6 1,500 181 7 1,250 254 8 750 228 9 1,500 126 10 1,500 166 11 750 45 12 750 237 13 1,000 75 14 1,750 126 15 1,750 249 16 1,750 105 17 1,750 298 18 1,250 212 19 750 98 20 750 185 Click here for the Excel Data File a. Compute the correlation between the wattage and heating area. Is there a direct or an indirect relationship? (Round your answer to 4 decimal places.) b. Conduct a test of hypothesis to determine if it is reasonable that the coefficient is greater than zero. Use the 0.050 significance level. (Round intermediate calculations and final answer to 3 decimal places.)H0: ρ ≤ 0; H1: ρ > 0 Reject H0 if t > 1.734…
- b) What are the three models proposed as extensions of the GARCH model? Describe their advantages over the GARCH.A dietitian wishes to see if a person’s cholesterol level will be changed if the diet is supplemented by a certain mineral. Four subjects were pre-tested, and they took the mineral supplement for a 6-week period. The results are shown in the table. Is there sufficient evidence to conclude that the population mean of cholesterol levels has been changed after six weeks at α=0.2α=0.2? Assume that the differences are from an approximately normally distributed population. Subject Cholestrol Level (mg/dl) Cholestrol Level after 6 Weeks (mg/dl) dd ¯dd¯ (d−¯d)2(d-d¯)2 1 206 217 11 2 219 184 -35 3 202 204 2 4 213 205 -8 Total -30 a) Calculate the mean, the sum of the squared deviation from the mean, and the standard deviation of differences. Do not include the unit for each answer: ¯d=d¯= (do not round) ∑(d−¯d)2=∑(d-d¯)2= (do not round) sd=sd= (rounded to one decimal place) b) Perform the hypothesis test in the following steps: Step 1.…4) Here are data on the lengths of male and female roaches (in mm). Your job is to find out if there is adifference between male and female roaches (this should be two sided - why?).males 15.4 13.9 12.7 9.6 6.6 10.7 9.9 13.3 16.2 9.0 11.4 16.6 12.2females 16.7 16.3 12.8 16.9 15.1 12.8 18.7 18.3 8.6 13.6 15.3 16.2 13.4It's up to you to figure out what the best procedure is, what kind of hypotheses to use, which α to use,what test to use, and so on. Make sure you follow all the appropriate steps. You should probably use Ras you’ll get done much quicker. Remember to very clearly state your results in writing. Never turn in just an R printout .Hint: how do you decide which test to use? What kind of distributions do the data have?
- An article in Technometrics (1974, Vol. 16, pp. 523–531) considered the following stack-loss data from a plant oxidizing ammonia to nitric acid. Twenty-one daily responses of stack loss (the amount of ammonia escaping) were measured with air flow x1, temperature x2, and acid concentration x3. y = 42, 37, 37, 28, 18, 18, 19, 20, 15, 14, 14, 13, 11, 12, 8, 7, 8, 8, 9, 15, 15 x1 = 80, 80, 75, 62, 62, 62, 62, 62, 58, 58, 58, 58, 58, 58, 50, 50, 50, 50, 50, 56, 70 x2 = 27, 27, 25, 24, 22, 23, 24, 24, 23, 18, 18, 17, 18, 19, 18, 18, 19, 19, 20, 20, 20 x3 = 89, 88, 90, 87, 87, 87, 93, 93, 87, 80, 89, 88, 82, 93, 89, 86, 72, 79, 80, 82, 91 (a) Fit a linear regression model relating the results of the stack loss to the three regressor variables. (b) Estimate σ2. (c) Find the standard error se(βj). (d) Use the model in part (a) to predict stack loss when x1 = 60, x2 = 26, and x3 = 85.2- An expert estimates that the distribution parameter for durability times of parts produced with machine A in the factory is different from the distribution parameter for durability times of parts produced with machine B. Durability times of 4 parts produced from machine A and 4 parts produced from machine B are given below. Find the Mann-Whitney U value by using these data. a) 18 B) 6 NS) 16 D) 20 TO) 12The Turbine Oil Oxidation Test (TOST) and the Rotating Bomb Oxidation Test (RBOT) are two different procedures for evaluating the oxidation stability of steam turbine oils. An article reported the accompanying observations on x = TOST time (hr) and y = RBOT time (min) for 12 oil specimens. TOST 4200 3600 3750 3650 4050 2770 RBOT 370 345 375 315 350 205 TOST 4870 4525 3450 2700 3750 3325 RBOT 400 380 285 220 345 290 (a) Calculate the value of the sample correlation coefficient. (Round your answer to four decimal places.) r = Carry out a test of hypotheses to decide whether RBOT Time and TOST time are linearly related. (Use ? = 0.05.) Calculate the test statistic and determine the P-value. (Round your test statistic to two decimal places and your P-value to three decimal places.) t = P-value =