3. The table below shows the number of absences in a class and the final exam grade of 7 randomly selected students. At 5% level can we say that there is a significant linear relationship between X and Y? Student 1 2 3 4 6 7 number of absences (X) 1 6. 4 3 3 final exam grade (Y) 95 90 90 55 70 80 85
3. The table below shows the number of absences in a class and the final exam grade of 7 randomly selected students. At 5% level can we say that there is a significant linear relationship between X and Y? Student 1 2 3 4 6 7 number of absences (X) 1 6. 4 3 3 final exam grade (Y) 95 90 90 55 70 80 85

Glencoe Algebra 1, Student Edition, 9780079039897, 0079039898, 2018
18th Edition
ISBN:9780079039897
Author:Carter
Publisher:Carter
Chapter10: Statistics
Section10.2: Representing Data
Problem 24PFA

Related questions
Question
Note: Use a computer application (SPSS) to solve for the following problems. And find the test statistic.
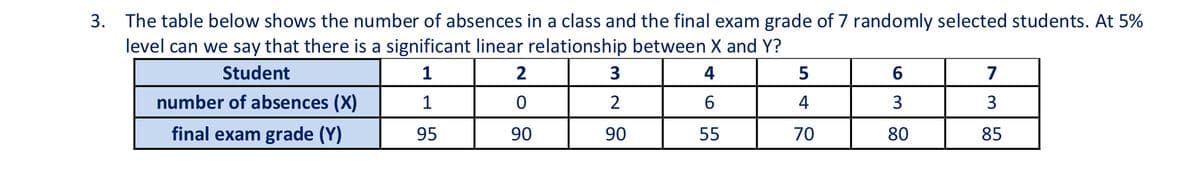
Transcribed Image Text:3. The table below shows the number of absences in a class and the final exam grade of 7 randomly selected students. At 5%
level can we say that there is a significant linear relationship between X and Y?
Student
1
3
4
5
7
number of absences (X)
1
2
4
3
3
final exam grade (Y)
95
90
90
55
70
80
85
Expert Solution
This question has been solved!
Explore an expertly crafted, step-by-step solution for a thorough understanding of key concepts.

This is a popular solution!

Trending now
This is a popular solution!

Step by step
Solved in 4 steps with 3 images

Recommended textbooks for you
Glencoe Algebra 1, Student Edition, 9780079039897…
Algebra
ISBN:
9780079039897
Author:
Carter
Publisher:
McGraw Hill

Algebra & Trigonometry with Analytic Geometry
Algebra
ISBN:
9781133382119
Author:
Swokowski
Publisher:
Cengage
Glencoe Algebra 1, Student Edition, 9780079039897…
Algebra
ISBN:
9780079039897
Author:
Carter
Publisher:
McGraw Hill
Algebra & Trigonometry with Analytic Geometry
Algebra
ISBN:
9781133382119
Author:
Swokowski
Publisher:
Cengage