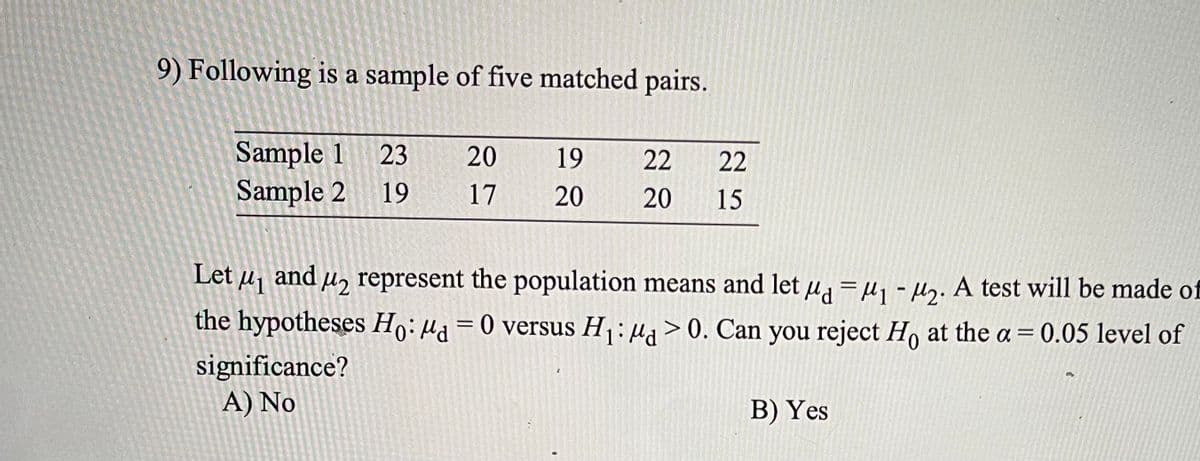
1 23 20 19 22 22 2 19 17 20 20 15 uz represent the population means and 1- eses Ho: Ha = 0 versus H1: µa > 0. Can y e?


Q: i: 1 2 3 4 5 6 7 16 3 21 8 X12: Y;: 33 41 49 5 31 42 33 75 28 16 55 ssion model (6.1) with…
A: *Answer:
Q: 7. In 2010 consumption (Ci) for selected countries was as follows Jordan 2.5 billion $, USA 100…
A:
Q: 12.54 John Swanson, president of Market Research Inc., has asked you to estimate the coefficients of…
A:
Q: 1. The experimental data on the hardness of the Hebel brick with 2 drying methods (methods A and B)…
A: Given the experimental data on the hardness of the Hebel brick with two drying methods(methods A and…
Q: 9(a). Suppose that in the "water and plant growth height" example we have four plants in the…
A: The following information has been given: 9(a.) x y 1 6.4 2 6.6 3 7.6 4 9.4 9(b.)…
Q: A sample is counted for 10 minutes and results in 530 gross counts. A 30-minute background count…
A: question: A sample is counted for 10 minutes and results in 530 gross counts. A 30-minute…
Q: DRUG DOSE 1 DRUG DOSE 2 DRUG DOSE 3 5 9 12 7 11 14 8 9 10 6 12 13 2. What is k (the number of…
A: The given data contains three drug dose levels.
Q: . Consider the following models: (1) Y = B1 + B2X +u (2) Y* = a, + a,X; + u lere X and Y are…
A: Given information: The two regression models are as given below:
Q: alan/ Question 2: ven a normally distributed population with a mear f) P(50 sxs 100) 9) P(X > 90) h)…
A: “Since you have posted a question with multiple sub-parts, we will solve first three subparts for…
Q: The population proportion of Americans with diabetes is 11 percent (π = 0.11). In repeated random…
A: The population proportion of Americans with diabetes is 11 percent (π = 0.11). In repeated random…
Q: 3.24 An article in the ACI Materials Journal (Vol. 84, 1987, pp. 213–216) describes several…
A: Rodding Level 10 15 20 25 1530 1610 1560 1500 1530 1650 1730 1490 1440 1500 1530…
Q: (3) a) Establish the relationship between the hazard function h(t) and in- cidence proportion at…
A: Given an estimated hazard function at time t=4 is 1.5.
Q: 8 F. b| 13 ョ|^,黑, I Normal T Aa A AaBbCcI AaBbCcI AABBCCD AaB AaBbCcI I No Spac... Heading 2…
A: As given in the test, we need to find if, the elderly people who own pets are equally likely to…
Q: In Exercises 37–42, find ||v|| and find the unit vector in the direction of v. 37. v = (3, –4) 38. v…
A: 37). Given vector is v=3,-4. To find v and find the unit vector in the direction of v. Solution: We…
Q: 6) Consider the following scatterplots of a dependent variable Y against an independent variable X.…
A: Hetersoskedasticity happens when the standard deviation of error term is not constant over different…
Q: (b) Given that M(t) = E(t-0)', show that it can also be written as: M(t) = V(t) +B*(t), where V(t)…
A:
Q: 1. We want to look at the relationship between the estimated cost (y) and the age of the vehicle…
A: 1.
Q: FromSa$sampleSof n = 15 readingsSon X = Traffic$Volume$(carsSperShour$) Sand Y = Carbon Monoxide…
A:
Q: a) A certain type of hummingbird is known to have an average weight of 4.55 grams. A researcher…
A:
Q: INV 2-3a Suppose that the index model for two Canadian stocks HD and ML is estimated with the…
A:
Q: 1. A sample of data is collected from a group of college students (X = 112, Sx = 12, N= 58). It is…
A:
Q: 9.4 Data consistent with summary quantities in the article referenced in the previous exercise on…
A: The given data is calorie intake for children when they do not consume fast food and when consumed…
Q: 4.28 Suppose that samples of polythene bags from two manufacturers A and B are tested by a buyer for…
A:
Q: 1. The following data table is obtained by a fourth grader on his science project, "Exploding Foam."…
A: Part a: We compute the mean and standard deviation using the excel formulae as below:…
Q: 1. The average normal daily temperature ( in degree Celsius) and the corresponding average monthly…
A: Here data is given : We have to calculate r value and regression equation, slope of regression line,…
Q: 1. The average normal daily temperature ( in degree Celsius) and the corresponding average monthly…
A: Given data is Temperature(x) 30 27 28 32 27 23 18 Precipitation(y) 3.4 1.8 3.5 3.6 3.7 1.5 0.2
Q: 1. Consider the data sets below, determine if it is reasonable to assume that y is proportional to…
A: Note:- Since you have asked multiple questions, we will solve the first question for you. If you…
Q: 13 15 8 14 25 29 19 13 24 18 23 29 8 16 24 3 29 29 28 16 19. Determine the following: Quartile 1…
A: From the data, it is observed that there are 21 observations. Ascending order of the observation is…
Q: Q 1.0 Steel sheet length # of sheets 60.1 1 60.15 6 60.2 12 60.25 18 60.3 85 60.35 214 60.4 339…
A: Given information: The data represents the frequency distribution of the variable steel sheet…
Q: Day 1 Day 2 Day 3 Day 4 Day 5 Day 6 Day 7 Average 31 35.5 31 40.5 34 39 37.5 time for Total process…
A: Correlation The correlation is a statistical technique that is used for analyzing the behavior and…
Q: 2.890 A consumer buying cooperative tested the effective heating area of 20 different electric space…
A: The independent variable is Wattage. The dependent variable is Area. We have to do correlation and…
Q: = 1, 2, 3, and 4 respectively.) 1.6: 59.9 53.5 56.7 63.2 58.6 3.8: 55.6 59.6 52.6 54.5 6.0: 51.2…
A: We want find the value of F and p value.
Q: -Ar 45. First three moments of a variable measured by point "2" are 1, 16 and - 40. Prove that mean…
A:
Q: A component has the following linear hazard rate, where t is in years a(t) = 0.4t, t2 0 a) Find R(t)…
A: Given: λ(t)=0.4 tt is in years
Q: Refer to Exercise 6. Assume that c = 448 J/kg°C and ΔQ = 1210 J are known with negligible…
A:
Q: Identify the following underlined quantitative variables as Discrete or continuous. Write D if…
A: (1) Identify the given quantitative variable is as Discrete or continuous. The correct option…
Q: d) -1.41 18. What is the correct decision in a hypothesis if the data produce a t-statistic that i…
A:
Q: Estimate a sample for a population of 5,000 inhabitants based on the following parameters: 1. Z^2…
A:
Q: Use the Stepwise Method 1.5 mg. dose (X,) 1.0 mg. dose Two groups of experimental rats were injected…
A: Null Hypothesis: A hypothesis which is tested for plausible rejection is called the Null Hypothesis…
Q: 3. The following model is estimated: sleep = 3840.83 – 0.163totwrk + 11.71educ + 8.70age + 0.128age?…
A: Given that
Q: 1 1/6 2 3 4 5 6 1/6 1/6 1/6 1/6 1/6 e expected value of X + Y - E(X+Y) and the -iance of X+Y-…
A: Solution
Q: 1. A report in LTO stated that the average age of taxis in the Philippines is 9 years. An operations…
A:
Q: You test a new drug to reduce blood pressure. A group of 15 patients with high blood pressure report…
A: Since you have posted a question with multiple sub-parts, we will solve first three sub-parts for…
Q: 8. Given two estimators X1 and X2 for a population mean, E[X1] = 6, V[X1] = 4, and V[X2] = 5. If the…
A:
Q: e standard deviation of a population of 400 volumes is 70 cm. In the case of "non-refundable…
A: The formula for standard error of sample average will be:
Q: Consider the accompanying data on plant growth after the application of different types of growth…
A: We want to find F value and p value by using anova test.
Q: S.N Temperature Humidity Yield 40 57 112 2 45 54 118 50 54 128 4 55 60 121 60 66 126 65 59 136 7 70…
A: Solution (d)
Q: ou test a new drug to reduce blood pressure. A group of 15 patients with high blood pressure report…
A: Note: Since the answers for part (a) and part(b) is not given. We need to find the confidence…


Step by step
Solved in 2 steps


- A large pizza chain has conducted a study to determine if the types of preferred pizza are independent of the region of the country where it is sold. One hundred random samples are selected in each region of the country with the following results. Areas Thin not Spicy Thin spicy Thick Crust not Spicy Thick Crust Spicy Total Samples Northeast 30 10 40 20 100 Northwest 25 20 45 10 100 Southwest 25 25 25 25 100 Southwest 15 30 10 45 100 Totals 95 85 120 100 400 Set up hypotheses to test if these preferred types of pizza are independent of the region of the country in which they are sold. Perform the appropriate statistical test to obtain your results. Calculate the p value and fully explain your results.Suppose that a random sample of size 1 is to be taken from a finite population of size N. a. How many possible samples are there?b. Identify the relationship between the possible sample means and the possible observations of the variable under consideration.c. What is the difference between taking a random sample of size 1 from a population and selecting a member at random from the population?In an experiment with the effect of different feeding on sheep fertility, two feed categories were examined, A and B. 192 rivers were given feed category A and 190 were given feed category B. The following number of monocotyledonous and dicotyledonous sheep were obtained in each category: Feed category A Feed category B Monocotyledonous 60 82 Dicotyledonous 132 108 Examine with an appropriate hypothesis test whether there is a difference in fertility by feed category.
- Suppose that in a study of 35 million HPV shots examined, the shots were followed in time by 14,000 serious ailments and 32 confirmed deaths. However, suppose in examining a randomly selected control group of 35 million non-vaccinated people of the same age at a particular time A, 0.0413% developed a serious ailment soon after time A, and 0.000089% died soon after time A. What does the comparison of two groups tell us? What are the percentages in the vaccinated group (serious ailments and confirmed deaths), and how to they compare to the nonvaccinated group? Hint: compute the percentages for serious ailments (14,000/35,000,000) and confirmed deaths (32/35,000,000) for the vaccinated group. Compare with the control group. Notice % above. (0,0413% and 0.000089%) Answer here. What can we conclude with high probability, if this comparison between vaccinated and non-vaccinated groups was done many times with the same basic results? Answer here. Can we absolutely rule out that the…In analyzing the consumption of cottage cheese by members of various occupational groups, the United Dairy Industry Association found that 326 of 837 professionals seldom or never ate cottage cheese, versus 220 of 489 white-collar workers and 522 of 1243 blue-collar workers (Sheet 53). Assuming independent samples, use the 0.03 level in testing the null hypothesis that the population proportions could be the same for the three occupational groups. Sheet 53 Group 1 Group 2 Group 3 Total seldom or never 326 220 522 1068 often 511 269 721 1501 Total 837 489 1243 2569 Select one: a) chi-square stat = 4.81, crit. value = 7.01, fail to reject H0, population proportions are not different b) p-value = 0.09, reject H0, population proportions are not different c) chi-square stat = 4.81, crit. value = 9.2, fail to reject H0, population proportions are not different d) p-value = 0.029, reject H0, population proportions differentThe number of contaminating particles on a silicon waferprior to a certain rinsing process was determined for eachwafer in a sample of size 100, resulting in the followingfrequencies:Number of particles 0 1 2 3 4 5 6 7Frequency 1 2 3 12 11 15 18 10Number of particles 8 9 10 11 12 13 14Frequency 12 4 5 3 1 2 1a. What proportion of the sampled wafers had at leastone particle? At least five particles?b. What proportion of the sampled wafers had betweenfive and ten particles, inclusive? Strictly between fiveand ten particles?c. Draw a histogram using relative frequency on thevertical axis. How would you describe the shape of thehistogram?
- The following table shows the pesticide residue levels (ppb) in blood samplesfrom three groups of human subjects, A, B and C. Use the Kruskal-Wallis totest the null hypothesis, if there is no difference among the groups withrespect to the average level of pesticide residue at 5% significance level.If there is a significant difference, you are required to do a multiplecomparison test.A 10 26 11 30 9 44 12 15 42 23B 3 34 32 20 19 11 6 32 16 8C 14 5 10 11 5 9 11 9 13 14Determine if assumptions have been violated and if a between-subjects, one-way ANOVA can be completed: A biomedical engineer compared the abrasion resistance — as measured by number of rotations until failure — of three different artificial hips. Manufacturer X makes hip joints out of metal, manufacturer Y out of ceramic, and manufacturer Z out of a metal/ceramic composite. The biomedical engineer gets a random sample of 6 hips from each manufacturer’s production line and tests each one individually until failure occurs.a random sample of 60 and in terms of age groups was stratified as follows: 35 are youth (below 35yrs) ,15 are medium aged adults between 35-65yrs and 10 are elderly (above 65yrs).Your research outcome is to determine their attitude regarding compulsory putting on of masks wherever in public during lifting up of COVID -19 Lockdown. You carry out a survey to determine the above outcome and come up with the following observations. Those with positive attitude are 34 detailed as follows: Youth 20, medium adults 9 and elderly 5. Those with negative attitude were stratified as follows:15 youth,6 medium adults and 5 elderly. (i) Sketch a 3 by 2 contingency summary of this data (ii) State the hypothesis of this data, giving your α-level and degree of freedom Critical t-value from the chi-square distribution is 5.991
- a random sample of 60 and in terms of age groups was stratified as follows: 35 are youth (below 35yrs) ,15 are medium aged adults between 35-65yrs and 10 are elderly (above 65yrs).Your research outcome is to determine their attitude regarding compulsory putting on of masks wherever in public during lifting up of COVID -19 Lockdown. You carry out a survey to determine the above outcome and come up with the following observations. Those with positive attitude are 34 detailed as follows: Youth 20, medium adults 9 and elderly 5. Those with negative attitude were stratified as follows:15 youth,6 medium adults and 5 elderly. (i) Sketch a 3 by 2 contingency summary of this data (ii) State the hypothesis of this data, giving your α-level and degree of freedomConsider the large-sample level .01 test in Section 8.4 for testing H0: p=.2 against Ha: p>.2. a) For the alternative value p=.21, compute beta(.21) for sample sizes n=100,2500,10,000,40,000,and 90,000. b) For p^=x/n=.21, compute the P-value when n=100, 2500, 10,000, and 40,000. c) In most situations, would it be reasonable to use a level .01 test in conjunction with a sample size of 40,000? Why or why not?A random sample of n1 = 10 regions in New England gave the following violent crime rates (per million population). x1: New England Crime Rate 3.8 3.9 5.0 3.4 3.3 4.1 1.8 4.8 2.9 3.1 Another random sample of n2 = 12 regions in the Rocky Mountain states gave the following violent crime rates (per million population). x2: Rocky Mountain Crime Rate 3.5 4.2 4.6 5.0 3.3 4.8 3.5 2.4 3.1 3.5 5.2 2.8 Assume that the crime rate distribution is approximately normal in both regions. Note: If a two-sample t-test is appropriate, for degrees of freedom d.f. not in the Student's t table, use the closest d.f. that is smaller. In some situations, this choice of d.f. may increase the P-value by a small amount and therefore produce a slightly more "conservative" answer.Use a calculator to calculate x1 , s1, x2 , and s2. (Round your answers to two decimal places.) x1 = s1 = x2 = s2 = (a) Do the data indicate that the violent crime rate in the Rocky Mountain…