31 The table shows the ages of 10 people and the numbers of concerts they attended in the last year. Concerts Attended 15 12 20 16 14 18 15 16 12 15 Age of Person (years) 2 3 2 3. 3 4 Number of Concerts Attended 4. Which scatterplot best represents all the data in the table? Concerts Attended Concerts Attended y C V12 14 16 18 20 12 14 16 18 20 Age (years) Age (years) Concerts Attended y Concerts Attended y 5 B 12 14 16 18 20 Age (years) 12 14 16 18 20 Age (years) Number of Concerts Attended Number of Concerts Attended Number of Concerts Attended Number of Concerts Attended
31 The table shows the ages of 10 people and the numbers of concerts they attended in the last year. Concerts Attended 15 12 20 16 14 18 15 16 12 15 Age of Person (years) 2 3 2 3. 3 4 Number of Concerts Attended 4. Which scatterplot best represents all the data in the table? Concerts Attended Concerts Attended y C V12 14 16 18 20 12 14 16 18 20 Age (years) Age (years) Concerts Attended y Concerts Attended y 5 B 12 14 16 18 20 Age (years) 12 14 16 18 20 Age (years) Number of Concerts Attended Number of Concerts Attended Number of Concerts Attended Number of Concerts Attended

Glencoe Algebra 1, Student Edition, 9780079039897, 0079039898, 2018
18th Edition
ISBN:9780079039897
Author:Carter
Publisher:Carter
Chapter10: Statistics
Section10.6: Summarizing Categorical Data
Problem 24PPS

Related questions

Concept explainers
Contingency Table
A contingency table can be defined as the visual representation of the relationship between two or more categorical variables that can be evaluated and registered. It is a categorical version of the scatterplot, which is used to investigate the linear relationship between two variables. A contingency table is indeed a type of frequency distribution table that displays two variables at the same time.
Binomial Distribution
Binomial is an algebraic expression of the sum or the difference of two terms. Before knowing about binomial distribution, we must know about the binomial theorem.
Topic Video
Question
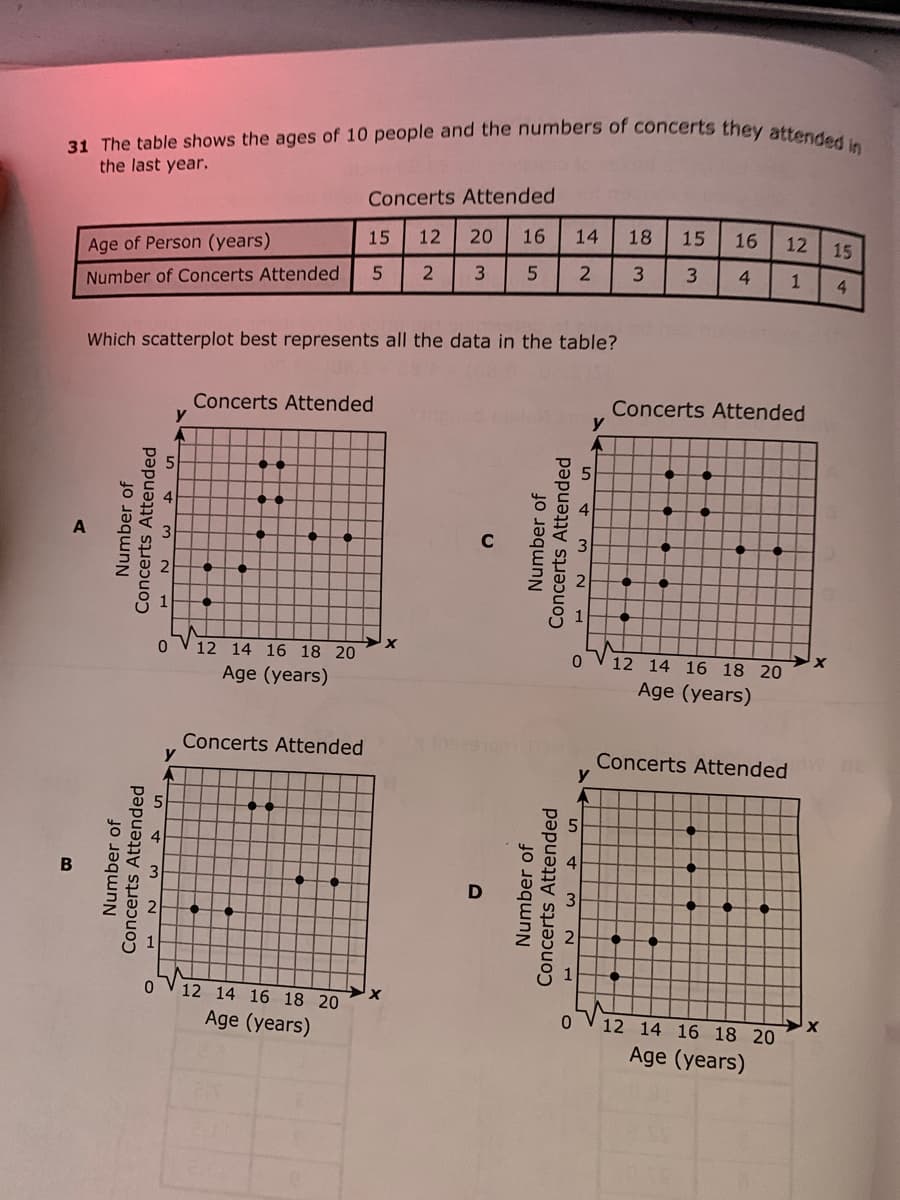
Transcribed Image Text:31 The table shows the ages of 10 people and the numbers of concerts they attended in
the last year.
Concerts Attended
15
12
20
16
14
18
15
16
12
15
Age of Person (years)
3
5
3
4.
1
4.
Number of Concerts Attended
Which scatterplot best represents all the data in the table?
Concerts Attended
y
Concerts Attended
y
V12 14 16 18 20
12 14 16 18 20
Age (years)
Age (years)
Concerts Attended
y
Concerts Attended
y
0.
12 14 16 18 20
Age (years)
12 14 16 18 20
Age (years)
Number of
Number of
Concerts Attended
Concerts Attended
Number of
Concerts Attended
Number of
Concerts Attended
Expert Solution
Step 1 basic information
Here we to just plot the given 10 points.

Trending now
This is a popular solution!

Step by step
Solved in 2 steps

Knowledge Booster


Learn more about
Need a deep-dive on the concept behind this application? Look no further. Learn more about this topic, calculus and related others by exploring similar questions and additional content below.Recommended textbooks for you
Glencoe Algebra 1, Student Edition, 9780079039897…
Algebra
ISBN:
9780079039897
Author:
Carter
Publisher:
McGraw Hill
Glencoe Algebra 1, Student Edition, 9780079039897…
Algebra
ISBN:
9780079039897
Author:
Carter
Publisher:
McGraw Hill