2. One of the interesting developments of the Covid pandemic has been the politicization of the vaccine. To explore this development we look at the following regression output based on data for all 50 states. The explanatory variable is the percent of the votes cast for Democratic president Joe Biden in the 2020 election. The response variable is the percent of the state's adult population who is fully vaccinated as of November 17. As an example, the data point representing Ohio is (45.24, 52.5). Use the output to answer the following questions. For the entire problem you can assume that regression assumptions are met. Coefficients: (Intercept) percent_vote 0.67964 Estimate Std. Error t value Pr(>|t|) 2.72840 0.05593 9.02 6.62e-12 *** 12.15 2.96e-16 *** 24.61108 Signif. codes: 0 ****' 0.001 **' 0.01 *' 0.05 '.' 0.1 ' ' 1 Multiple R-squared: F-statistic: 147.7 on 1 and 48 DF, Residual standard error: 4.055 on 48 degrees of freedom Adjusted R-squared: p-value: 2.955e-16 0.7547, 0.7496 Test an appropriate hypothesis at a = .05 to determine if there is a linear relationship a. between the percent of a state's votes cast for Biden and the vaccination rate. The percent who voted for Biden was 9.09 percentage points higher in Ohio than in Kentucky. How much higher of a percentage of Ohio adults would we expect to be vaccinated than Kentucky b. adults? С. What is the residual for the state of Ohio?
2. One of the interesting developments of the Covid pandemic has been the politicization of the vaccine. To explore this development we look at the following regression output based on data for all 50 states. The explanatory variable is the percent of the votes cast for Democratic president Joe Biden in the 2020 election. The response variable is the percent of the state's adult population who is fully vaccinated as of November 17. As an example, the data point representing Ohio is (45.24, 52.5). Use the output to answer the following questions. For the entire problem you can assume that regression assumptions are met. Coefficients: (Intercept) percent_vote 0.67964 Estimate Std. Error t value Pr(>|t|) 2.72840 0.05593 9.02 6.62e-12 *** 12.15 2.96e-16 *** 24.61108 Signif. codes: 0 ****' 0.001 **' 0.01 *' 0.05 '.' 0.1 ' ' 1 Multiple R-squared: F-statistic: 147.7 on 1 and 48 DF, Residual standard error: 4.055 on 48 degrees of freedom Adjusted R-squared: p-value: 2.955e-16 0.7547, 0.7496 Test an appropriate hypothesis at a = .05 to determine if there is a linear relationship a. between the percent of a state's votes cast for Biden and the vaccination rate. The percent who voted for Biden was 9.09 percentage points higher in Ohio than in Kentucky. How much higher of a percentage of Ohio adults would we expect to be vaccinated than Kentucky b. adults? С. What is the residual for the state of Ohio?

College Algebra
7th Edition
ISBN:9781305115545
Author:James Stewart, Lothar Redlin, Saleem Watson
Publisher:James Stewart, Lothar Redlin, Saleem Watson
Chapter1: Equations And Graphs
Section: Chapter Questions
Problem 10T: Olympic Pole Vault The graph in Figure 7 indicates that in recent years the winning Olympic men’s...

Related questions
Question
Please show all wor so i can understand
thank you
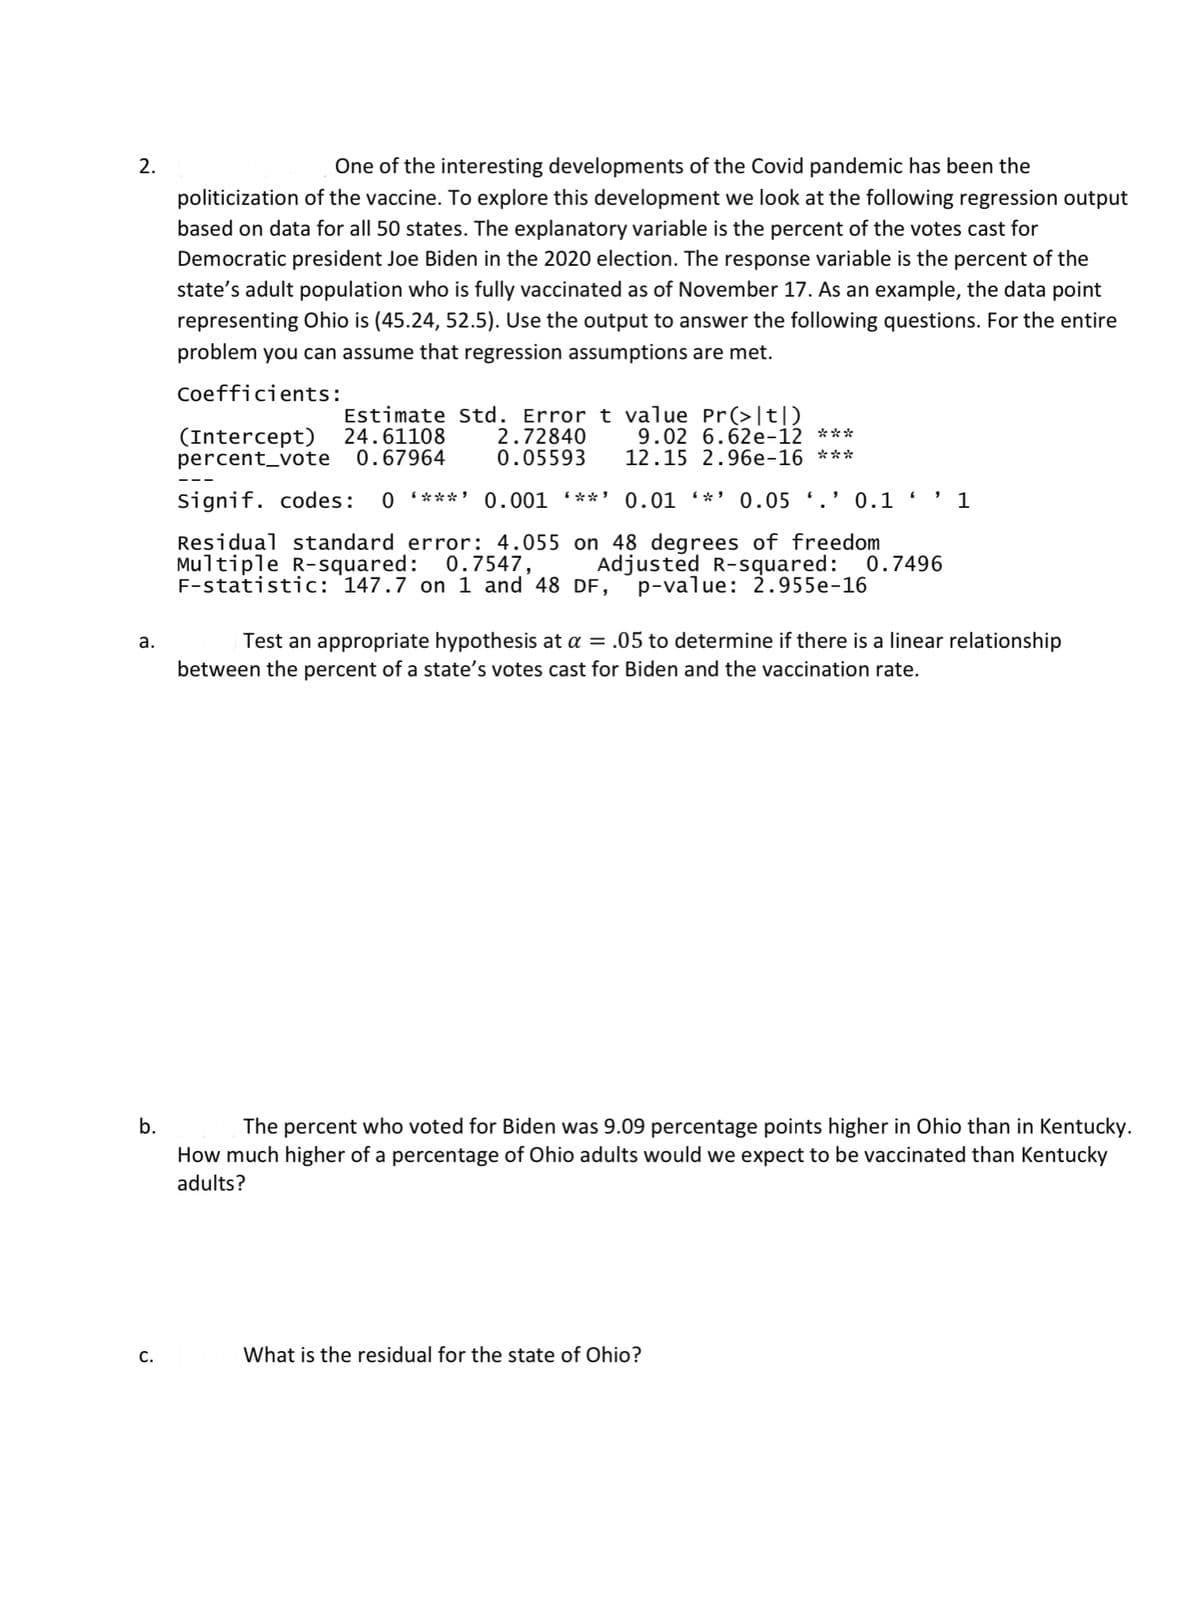
Transcribed Image Text:2.
One of the interesting developments of the Covid pandemic has been the
politicization of the vaccine. To explore this development we look at the following regression output
based on data for all 50 states. The explanatory variable is the percent of the votes cast for
Democratic president Joe Biden in the 2020 election. The response variable is the percent of the
state's adult population who is fully vaccinated as of November 17. As an example, the data point
representing Ohio is (45.24, 52.5). Use the output to answer the following questions. For the entire
problem you can assume that regression assumptions are met.
Coefficients:
(Intercept)
percent_vote 0.67964
Estimate Std. Error t value Pr(>|t|D
2.72840
0.05593
9.02 6.62e-12 ***
12.15 2.96e-16 ***
24.61108
Signif. codes:
***'
0.001 (**'
0.01 *'
0.05 '.' 0.1
1
Residual standard error: 4.055 on 48 degrees of freedom
Multiple R-squared: 0.7547,
F-statistic: 147.7 on 1 and 48 DF, p-value: 2.955e-16
Adjusted R-squared: 0.7496
а.
Test an appropriate hypothesis at a = .05 to determine if there is a linear relationship
between the percent of a state's votes cast for Biden and the vaccination rate.
b.
The percent who voted for Biden was 9.09 percentage points higher in Ohio than in Kentucky.
How much higher of a percentage of Ohio adults would we expect to be vaccinated than Kentucky
adults?
C.
What is the residual for the state of Ohio?
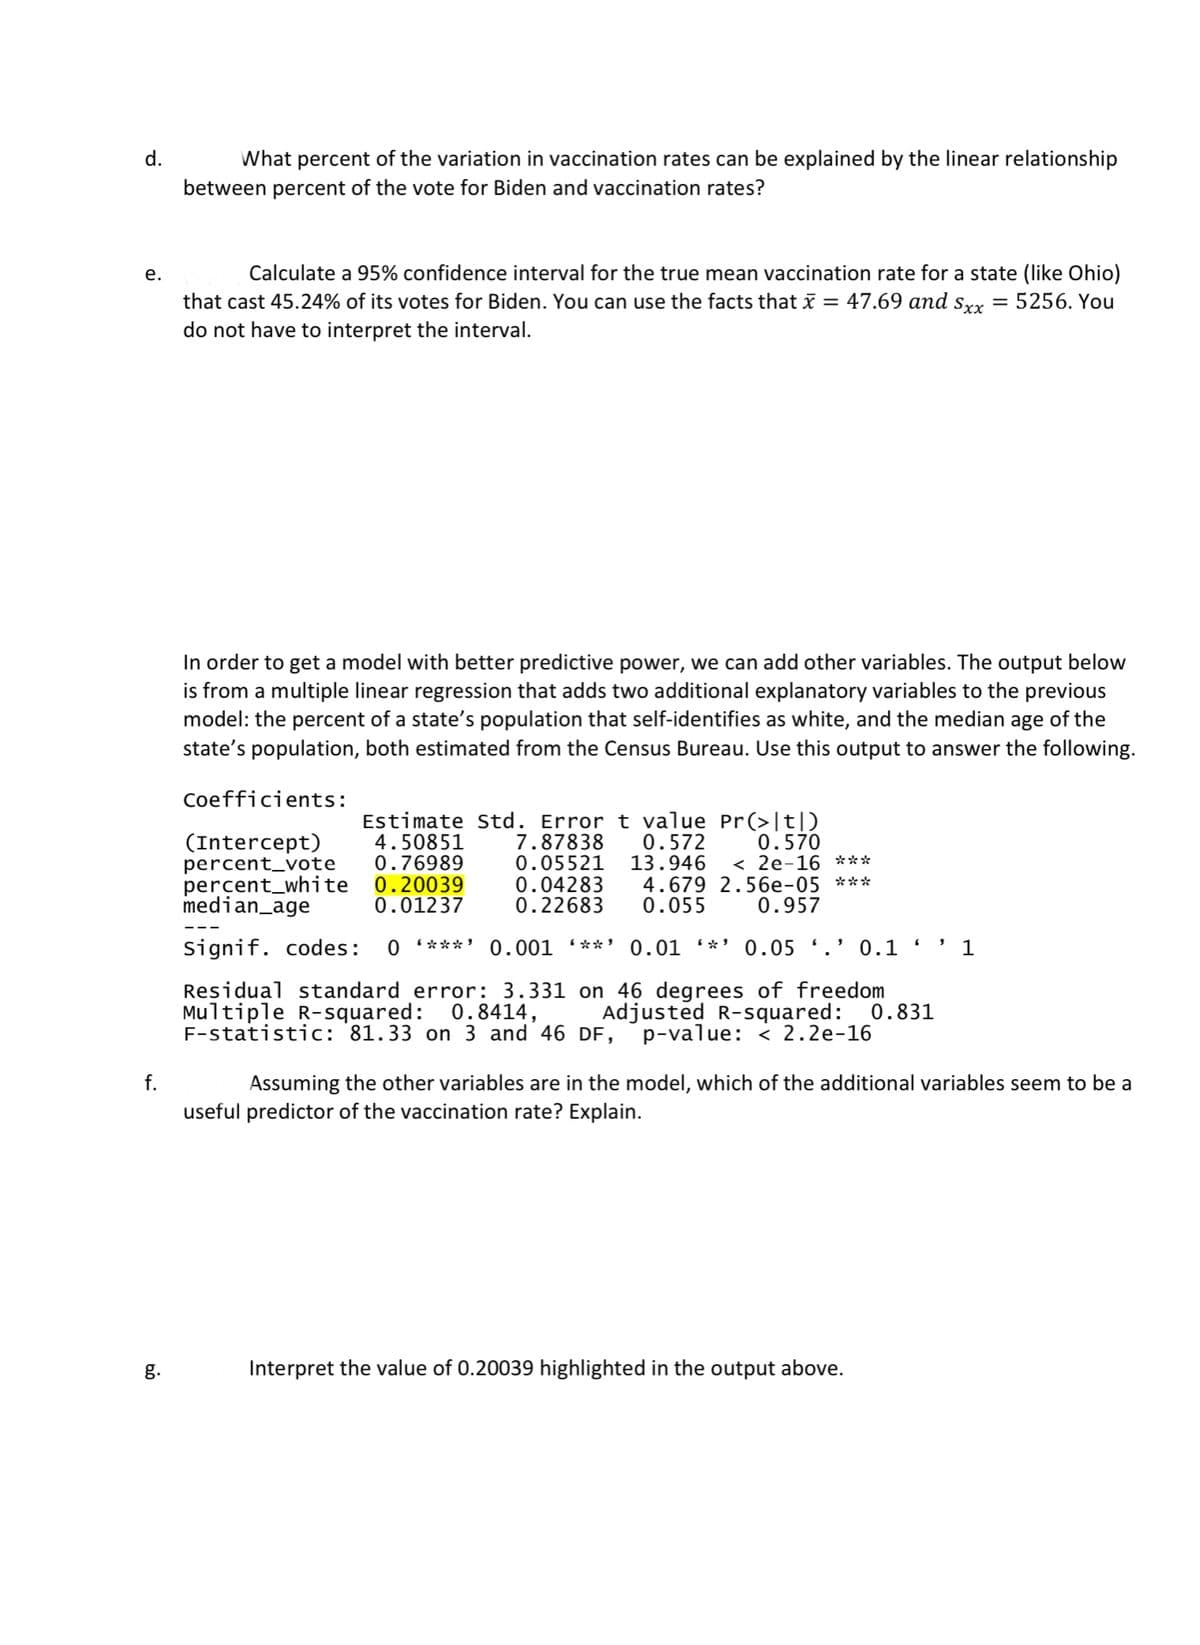
Transcribed Image Text:d.
What percent of the variation in vaccination rates can be explained by the linear relationship
between percent of the vote for Biden and vaccination rates?
е.
Calculate a 95% confidence interval for the true mean vaccination rate for a state (like Ohio)
that cast 45.24% of its votes for Biden. You can use the facts that x = 47.69 and srx
do not have to interpret the interval.
5256. You
In order to get a model with better predictive power, we can add other variables. The output below
is from a multiple linear regression that adds two additional explanatory variables to the previous
model: the percent of a state's population that self-identifies as white, and the median age of the
state's population, both estimated from the Census Bureau. Use this output to answer the following.
Coefficients:
Estimate Std. Error t value Pr(>|t|D
7.87838
0.05521
0.04283
0.22683
0.570
< 2e-16 ***
(Intercept)
percent_vote
percent_white
median_age
4.50851
0.76989
0.20039
0.01237
0.572
13.946
4.679 2.56e-05 ***
0.055
0.957
signif. codes:
0 ***' 0.001 (**' 0.01 *' 0.05 '.' 0.1
1
Residual standard error: 3.331 on 46 degrees of freedom
Multiple R-squared: 0.8414,
F-statistic: '81.33 on 3 and 46 DF,
Adjusted R-squared: 0.831
p-value: < 2.2e-16
f.
Assuming the other variables are in the model, which of the additional variables seem to be a
useful predictor of the vaccination rate? Explain.
g.
Interpret the value of 0.20039 highlighted in the output above.
Expert Solution
This question has been solved!
Explore an expertly crafted, step-by-step solution for a thorough understanding of key concepts.

Step by step
Solved in 5 steps with 1 images

Recommended textbooks for you
College Algebra
Algebra
ISBN:
9781305115545
Author:
James Stewart, Lothar Redlin, Saleem Watson
Publisher:
Cengage Learning

Linear Algebra: A Modern Introduction
Algebra
ISBN:
9781285463247
Author:
David Poole
Publisher:
Cengage Learning

Glencoe Algebra 1, Student Edition, 9780079039897…
Algebra
ISBN:
9780079039897
Author:
Carter
Publisher:
McGraw Hill
College Algebra
Algebra
ISBN:
9781305115545
Author:
James Stewart, Lothar Redlin, Saleem Watson
Publisher:
Cengage Learning
Linear Algebra: A Modern Introduction
Algebra
ISBN:
9781285463247
Author:
David Poole
Publisher:
Cengage Learning
Glencoe Algebra 1, Student Edition, 9780079039897…
Algebra
ISBN:
9780079039897
Author:
Carter
Publisher:
McGraw Hill

Big Ideas Math A Bridge To Success Algebra 1: Stu…
Algebra
ISBN:
9781680331141
Author:
HOUGHTON MIFFLIN HARCOURT
Publisher:
Houghton Mifflin Harcourt