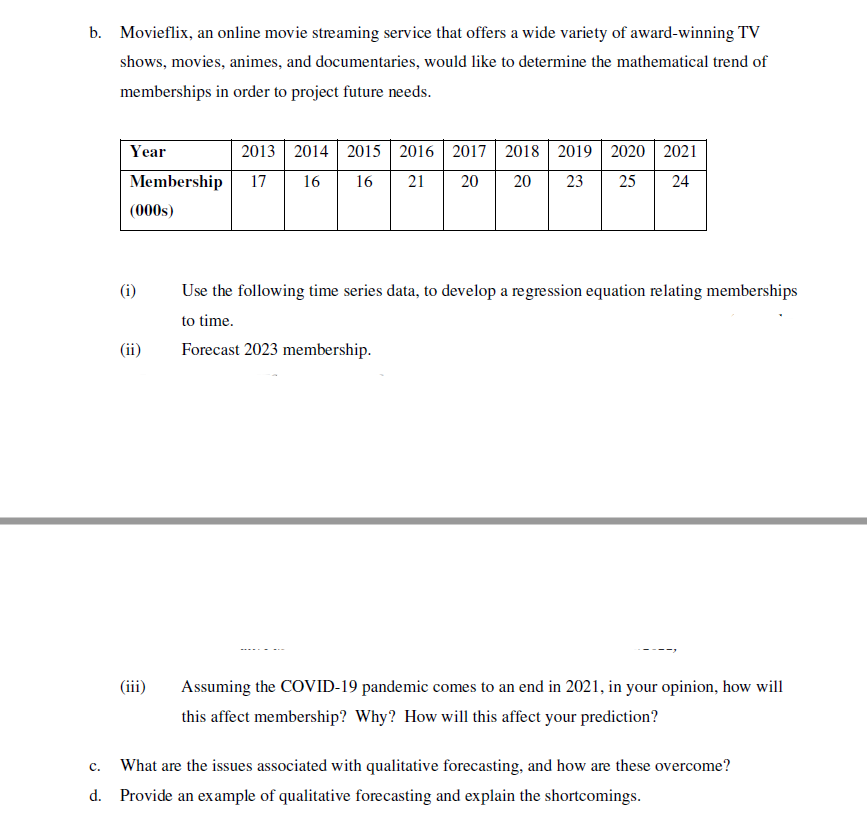
b. Movieflix, an online movie streaming service that offers a wide variety of award-winning TV shows, movies, animes, and documentaries, would like to determine the mathematical trend of memberships in order to project future needs. Year 2013 2014 2015 2016 | 2017 | 2018 | 2019 | 2020 | 2021 Membership 17 16 16 21 20 20 23 25 24 (000s) (i) Use the following time series data, to develop a regression equation relating memberships to time. (ii) Forecast 2023 membership. . .. (iii) Assuming the COVID-19 pandemic comes to an end in 2021, in your opinion, how will this affect membership? Why? How will this affect your prediction?
b. Movieflix, an online movie streaming service that offers a wide variety of award-winning TV shows, movies, animes, and documentaries, would like to determine the mathematical trend of memberships in order to project future needs. Year 2013 2014 2015 2016 | 2017 | 2018 | 2019 | 2020 | 2021 Membership 17 16 16 21 20 20 23 25 24 (000s) (i) Use the following time series data, to develop a regression equation relating memberships to time. (ii) Forecast 2023 membership. . .. (iii) Assuming the COVID-19 pandemic comes to an end in 2021, in your opinion, how will this affect membership? Why? How will this affect your prediction?

College Algebra
7th Edition
ISBN:9781305115545
Author:James Stewart, Lothar Redlin, Saleem Watson
Publisher:James Stewart, Lothar Redlin, Saleem Watson
Chapter1: Equations And Graphs
Section: Chapter Questions
Problem 10T: Olympic Pole Vault The graph in Figure 7 indicates that in recent years the winning Olympic men’s...

Related questions
Question
Transcribed Image Text:b. Movieflix, an online movie streaming service that offers a wide variety of award-winning TV
shows, movies, animes, and documentaries, would like to determine the mathematical trend of
memberships in order to project future needs.
Year
2013 2014 | 2015 2016
2017 2018 2019 | 2020 | 2021
Membership
17
16
16
21
20
20
23
25
24
(000s)
(i)
Use the following time series data, to develop a regression equation relating memberships
to time.
(ii)
Forecast 2023 membership.
(iii)
Assuming the COVID-19 pandemic comes to an end in 2021, in your opinion, how will
this affect membership? Why? How will this affect your prediction?
What are the issues associated with qualitative forecasting, and how are these overcome?
c.
d. Provide an example of qualitative forecasting and explain the shortcomings.
Expert Solution
This question has been solved!
Explore an expertly crafted, step-by-step solution for a thorough understanding of key concepts.

Step by step
Solved in 4 steps with 7 images

Recommended textbooks for you
College Algebra
Algebra
ISBN:
9781305115545
Author:
James Stewart, Lothar Redlin, Saleem Watson
Publisher:
Cengage Learning
College Algebra
Algebra
ISBN:
9781305115545
Author:
James Stewart, Lothar Redlin, Saleem Watson
Publisher:
Cengage Learning