2. Statistical Abstracts (117th edition) reports gasoline excise taxes, in cents per gallon, in the west (mountain region) as follows: 22 19 18 19 24 28 26 Find the mean, the median, and the mode of these taxes.
2. Statistical Abstracts (117th edition) reports gasoline excise taxes, in cents per gallon, in the west (mountain region) as follows: 22 19 18 19 24 28 26 Find the mean, the median, and the mode of these taxes.

Glencoe Algebra 1, Student Edition, 9780079039897, 0079039898, 2018
18th Edition
ISBN:9780079039897
Author:Carter
Publisher:Carter
Chapter10: Statistics
Section10.5: Comparing Sets Of Data
Problem 13PPS

Related questions
Question
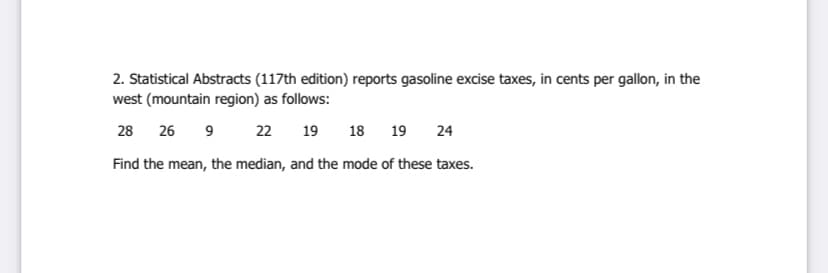
Transcribed Image Text:2. Statistical Abstracts (117th edition) reports gasoline excise taxes, in cents per gallon, in the
west (mountain region) as follows:
28 26 9
22
19
18
19
24
Find the mean, the median, and the mode of these taxes.
Expert Solution
This question has been solved!
Explore an expertly crafted, step-by-step solution for a thorough understanding of key concepts.

This is a popular solution!

Trending now
This is a popular solution!

Step by step
Solved in 2 steps

Recommended textbooks for you
Glencoe Algebra 1, Student Edition, 9780079039897…
Algebra
ISBN:
9780079039897
Author:
Carter
Publisher:
McGraw Hill
Glencoe Algebra 1, Student Edition, 9780079039897…
Algebra
ISBN:
9780079039897
Author:
Carter
Publisher:
McGraw Hill