2. Suppose that light is passing through an aqueous copper solution (copper solute dissolved in water). Beer's law says that the absorption of light (intensity units) is linearly related to the concentration of copper in the solution (ppm). Suppose that solutions of 0.5, 1, 5, 10, and 15 ppm are prepared and the light absorption is measured in a lab. These measurements were made in the Brandon University chemistry lab this term. Concentration (ppm) 0.5 1 10 15 Absorption 1.97 4.17 24.37 53.17 76.30 Plot these data points on a graph, determine the least squares line approximating these data, and sketch the line. Do this problem by first projecting a vector onto a column space.
2. Suppose that light is passing through an aqueous copper solution (copper solute dissolved in water). Beer's law says that the absorption of light (intensity units) is linearly related to the concentration of copper in the solution (ppm). Suppose that solutions of 0.5, 1, 5, 10, and 15 ppm are prepared and the light absorption is measured in a lab. These measurements were made in the Brandon University chemistry lab this term. Concentration (ppm) 0.5 1 10 15 Absorption 1.97 4.17 24.37 53.17 76.30 Plot these data points on a graph, determine the least squares line approximating these data, and sketch the line. Do this problem by first projecting a vector onto a column space.

Linear Algebra: A Modern Introduction
4th Edition
ISBN:9781285463247
Author:David Poole
Publisher:David Poole
Chapter2: Systems Of Linear Equations
Section2.4: Applications
Problem 2EQ: 2. Suppose that in Example 2.27, 400 units of food A, 500 units of B, and 600 units of C are placed...

Related questions
Question
5
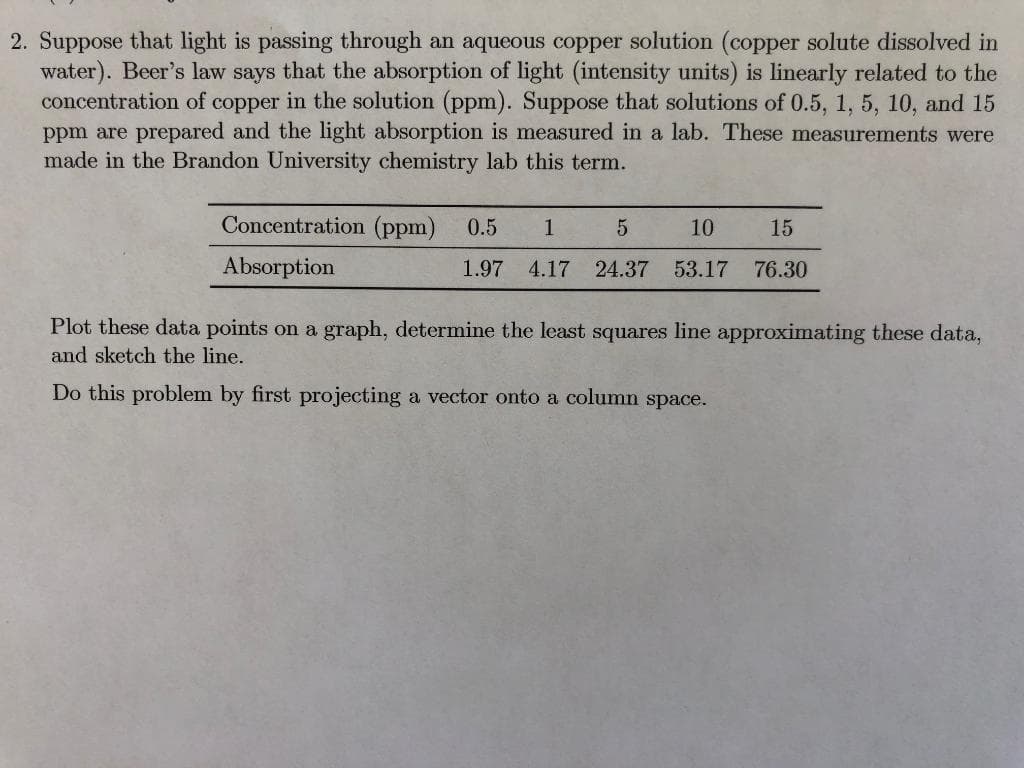
Transcribed Image Text:2. Suppose that light is passing through an aqueous copper solution (copper solute dissolved in
water). Beer's law says that the absorption of light (intensity units) is linearly related to the
concentration of copper in the solution (ppm). Suppose that solutions of 0.5, 1, 5, 10, and 15
ppm are prepared and the light absorption is measured in a lab. These measurements were
made in the Brandon University chemistry lab this term.
Concentration (ppm)
0.5
1
10
15
Absorption
1.97
4.17
24.37
53.17
76.30
Plot these data points on a graph, determine the least squares line approximating these data,
and sketch the line.
Do this problem by first projecting a vector onto a column space.
Expert Solution
This question has been solved!
Explore an expertly crafted, step-by-step solution for a thorough understanding of key concepts.

Step by step
Solved in 3 steps with 3 images

Recommended textbooks for you
Linear Algebra: A Modern Introduction
Algebra
ISBN:
9781285463247
Author:
David Poole
Publisher:
Cengage Learning

Algebra & Trigonometry with Analytic Geometry
Algebra
ISBN:
9781133382119
Author:
Swokowski
Publisher:
Cengage

Mathematics For Machine Technology
Advanced Math
ISBN:
9781337798310
Author:
Peterson, John.
Publisher:
Cengage Learning,
Linear Algebra: A Modern Introduction
Algebra
ISBN:
9781285463247
Author:
David Poole
Publisher:
Cengage Learning
Algebra & Trigonometry with Analytic Geometry
Algebra
ISBN:
9781133382119
Author:
Swokowski
Publisher:
Cengage
Mathematics For Machine Technology
Advanced Math
ISBN:
9781337798310
Author:
Peterson, John.
Publisher:
Cengage Learning,