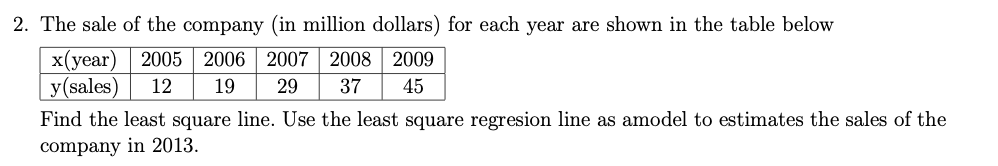
2. The sale of the company (in million dollars) for each year are shown in the table below x(year) | 2005 2006 | 2007 | 2008 | 2009 y(sales) 12 19 29 37 45 Find the least square line. Use the least square regresion line as amodel to estimates the sales of the company in 2013.
2. The sale of the company (in million dollars) for each year are shown in the table below x(year) | 2005 2006 | 2007 | 2008 | 2009 y(sales) 12 19 29 37 45 Find the least square line. Use the least square regresion line as amodel to estimates the sales of the company in 2013.

Algebra & Trigonometry with Analytic Geometry
13th Edition
ISBN:9781133382119
Author:Swokowski
Publisher:Swokowski
Chapter10: Sequences, Series, And Probability
Section10.8: Probability
Problem 64E

Related questions
Question
Transcribed Image Text:2. The sale of the company (in million dollars) for each year are shown in the table below
2005 2006 | 2007 2008 2009
x(year)
y(sales)
12
19
29
37
45
Find the least square line. Use the least square regresion line as amodel to estimates the sales of the
company in 2013.
Expert Solution
This question has been solved!
Explore an expertly crafted, step-by-step solution for a thorough understanding of key concepts.

This is a popular solution!

Trending now
This is a popular solution!

Step by step
Solved in 2 steps with 3 images

Knowledge Booster


Learn more about
Need a deep-dive on the concept behind this application? Look no further. Learn more about this topic, statistics and related others by exploring similar questions and additional content below.Recommended textbooks for you
Algebra & Trigonometry with Analytic Geometry
Algebra
ISBN:
9781133382119
Author:
Swokowski
Publisher:
Cengage

Algebra: Structure And Method, Book 1
Algebra
ISBN:
9780395977224
Author:
Richard G. Brown, Mary P. Dolciani, Robert H. Sorgenfrey, William L. Cole
Publisher:
McDougal Littell
Algebra & Trigonometry with Analytic Geometry
Algebra
ISBN:
9781133382119
Author:
Swokowski
Publisher:
Cengage
Algebra: Structure And Method, Book 1
Algebra
ISBN:
9780395977224
Author:
Richard G. Brown, Mary P. Dolciani, Robert H. Sorgenfrey, William L. Cole
Publisher:
McDougal Littell