20 18 S 16 14 12 10 8 Page 1 D 6 4 2 0 1 2 3 4 5 6 7 8 9 10 11 12 Quantity 
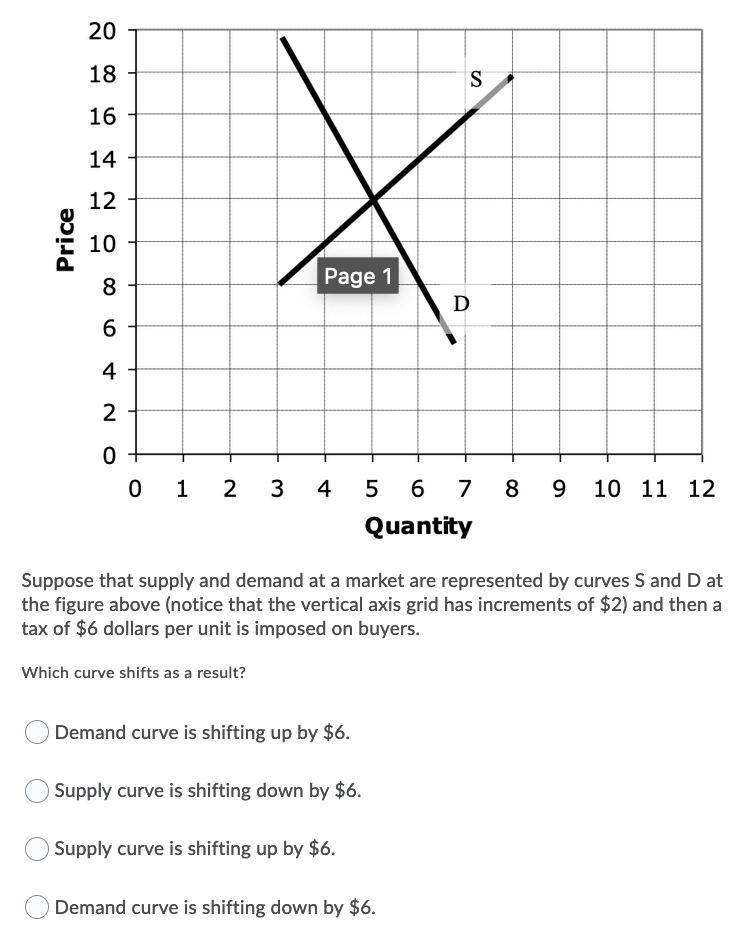
Suppose that supply and demand at a market are represented by curves S and D at the figure above (notice that the vertical axis grid has increments of $2) and then a tax of $6 dollars per unit is imposed on buyers. Which curve shifts as a result? Demand curve is shifting up by $6. Supply curve is shifting down by $6. Supply curve is shifting up by $6. Demand curve is shifting down by $6. Price
Q: Price P4 Supply A P3 B P2 H P1 F Demand Q2 Q1 Quantity
A: Producer surplus is the aggregate sum that a producer surplus from producing and selling an amount o...
Q: 2. The following hypothetical table is John's demand for pandesal from Dec 2016 to January 2017 give...
A: The economics as a study is based upon the basic idea of scarcity, or the limit present to the amoun...
Q: Three accuracy problems with the consumer price index (CPI) are O a) price confusion, substitution, ...
A: Substitution bias. Substitution bias occurs because the CPI measures the price changes of a fixed ba...
Q: The gross domestic product (GDP) deflator is a measure of the price level that includes prices of a)...
A: The formula for GDP deflator is GDP Deflator = (Nominal GDP / Real GDP) * 100
Q: Question 25 A computer company builds a new factory. This building is included in the category of gr...
A: The value of all final goods and services in an economy over the course of a year is referred to as ...
Q: The federal budget usually shows a surplus. True or False?
A: The economics as a study is based upon the idea that the resources which are present with the econom...
Q: Provide at least three examples and discuss, illustrating how firms can use discounts while avoiding...
A: The reduction that is being made from the gross amount of value of goods and services is known as a ...
Q: Data for movie tickets Quantity demanded Price ($ per ticket) (tickets per day) 7 300 8 200 100
A: Elasticity of demand measures the responsiveness of quantity demanded with respect to change in pric...
Q: Question 1 An economy is described by the following equations, where all the variables have the usua...
A: Given Consumption expenditure C =1700 +0.8(Y-T)-2000r ... (1)Planned investement exp...
Q: A consumer has product happiness function c1*c2. When this consumer eats 5 apples and 3 bananas, the...
A: Happiness function: - It shows the functional relationship between the consumption of goods and serv...
Q: he Additional Insured—Vendors (HO 07 51) endorsement to a homeowners policy extends the definition o...
A: An additional insured means in a liability policy broadens the inclusion past the named safeguarded ...
Q: 1. Suppose that there are 1200 units of a nonrenewable resource available over two periods (0 and 1)...
A: Given; Units of Nonrenewable resource available= 1200 Demand in each period; P=2000-Z Marginal cost=...
Q: how smart growth is making cities more sustainable.
A: Macroeconomics is a branch of economics which is important for a country. Aggregate demand and aggre...
Q: he price of train travel increases from $10 to $11 and the demand for train travel falls from ,000 t...
A: Elasticity of demand depicts how much consumer responds with the change in the price level.
Q: Use the information below to find the missing information. Chase Bank Liabilities Assets Total Reser...
A: The reserve ratio is the portion of reservable liabilities that commercial banks must hold onto, rat...
Q: Depict the following scenario using a graph. Assume that Major League Baseball goes from having free...
A: Monopsony is a market situation where by there are many suppliers but the buyer is only one. In this...
Q: Which of the following statements are true? You may need to check public data. Select one or more: O...
A: The measure that depicts the total value of goods and services being produced in an economy during a...
Q: Which of the following price elasticities of demand would indicate inelastic demand? O 1 O 10 O 0.5 ...
A: Price elasticity measures the responsiveness of demand of a good to its change in price of that good...
Q: What would have been an economic and social impact of the Baby Boom in the late 1940s and the 1950s?...
A: The answer is - The demand for teachers would increase for two decades.
Q: What is the Nash Equilibria of the following game? Penalty Game Кeeper L R Striker L 1,-1 -1, 1 R -1...
A: We solve this game using probabilities and thus the Nash Equilibrium is termed as mixed strategy Nas...
Q: 5. Number the following supply curves from lowest to highest elasticity.
A: Flatter curves are associated with greater elasticity and steeper curves are associated with lesser ...
Q: Draw the market for electricity below with the knowledge that the energy market is the greatest glob...
A: Negative externalities arise when the use or production of an item has a negative effect on a third ...
Q: If the elasticity of demand for a commodity is estimated to be 1.5, then a decrease in price from OR...
A: Price elasticity of demand is a measurement of the change in the consumption of a product in relatio...
Q: Paulina sells beef in a competitive market where the price is $5 per pound. Her total revenue and to...
A: Marginal revenue is a central concept in microeconomics that describes the additional total revenue ...
Q: Answer the following questions: Instructions: Enter your answers rounded to the nearest whole numb...
A: MPC, marginal propensity to consume is the proportion of change in income that is spent on consumpti...
Q: The consumer surplus from a good is measured by the A) area of the triangle above the market price l...
A: We know that the marginal benefit is the additional benefit received by consuming one additional uni...
Q: Question 1 If the full-employment GDP is $5,040, then the economy of country T experiences an econom...
A: Answer - "Thank you for submitting the questions.But, we are authorized to solve one question at a t...
Q: The following information is for the fictitious nation Alpha: Working-age population = 1.5 million L...
A: The labour force participation rate is the measure to evaluate working-age population in an economy ...
Q: The five force model is a framework
A: The model that represents economic processes through a set of variables and a set of logic and relat...
Q: the Valuc Personal disposable (net) income ii. GDP Total Savings i. iii. p) Assuming the U.S economy...
A: Considering a closed economy meaning economy is not open to foreign trade. Personal Disposable (net)...
Q: The Board of Governors of Federal Reserve have 14-year terms of office and the Federal Reserve is a ...
A: Federal reserve is the central bank of America . Central bank controls , manage the entire monetary ...
Q: A multiple regression of y on a constant x, and x2 produces the following results: ý = 4 + 0.4x + 0....
A: Given that : The objective of the following analysis is to test the null hypothesis that the two slo...
Q: A monopoly has long run total cost given by: TC = 61 + 6'Q + 0.4'Q, where Q represents the units of ...
A: Given Total cost function: TC=61+6Q+0.4Q2 Monopolist profit-maximizing level of Q is 40.87 and maxim...
Q: In a company operational activities are performed to fabricate products or to provide services. With...
A: Introduction Operational activities of a company has given. Primary cost of different product or ser...
Q: A firm produces good Y with just 2 factors: Capital which is fixed in supply and labour which is var...
A: "Since you have asked a question with multiple sub-parts, we will solve the first three sub-parts fo...
Q: Question 17 The 1974 federal legislation that exempted emplovers from certain state laws governing h...
A: The 1974 federal legislation that exempted employers from certain state laws governing health insura...
Q: a) Examine the market structure of the corn market. Draw a suitable corn market and also an individ...
A: A market is a place where buyers and sellers can gather to facilitate the exchange of goods and serv...
Q: b) If two regression models are fit to the same population having two different samples, what are th...
A: Regression is the methodology applied to test the relationship between two or more variables. One in...
Q: 3. Suppose the MPC is 0.8. The government wants to decrease Total Spending by $600. How should it ch...
A: GIVEN MPC = 0.8 decrease in Total spending = $600 (ie. ΔAD) Change in G to achieve (ΔAD=$600) goal...
Q: Question 41 If inflation occurs in a country, we know that a) both real and nominal wages are rising...
A: Correct option is b).
Q: The transmission mechanism of monetary policy is how central banks attempt to control the price leve...
A: Monetary policy is the policy instrument of central bank under which it aims to control the money su...
Q: Assume in a given company the marginal productivity can be characterized by the following function M...
A: At the marketplace, a firm tries to maximize its profit, due to which it makes constraints for resou...
Q: Joe has a full-time construction job and also does odd jobs for people on the weekends but does not ...
A:
Q: 20 18 16 14 12 10 8 D 4 2 0 1 2 4 5 6 7 8 9 10 11 12 Quantity Suppose that supply and demand at a ma...
A: please find the answer below.
Q: Hey can someone help me with this? Explain the main differences between amortization, annuity and in...
A: The term loan refers to a form of credit vehicle within which a complete of money is Lent to a diffe...
Q: what is Regressive Tax System in economics?
A: A regressive tax system refers to the system of taxation where tax rate and taxable amount are inver...
Q: Albert Einstein once noted that, "Compounding of interest is one of humanity's greatest inventions"....
A: Formula for quarterly compound interest is as follows, F = P * [ { (1 + r/4)n*4 – 1 } / r/4 ]
Q: Fully explain why the marginal revenue curve of a single-price monopolist lies below that firm’s dem...
A: Why the marginal revenue curve of a single-price monopolist lies below that firm’s demand curve??
Q: a) What is the growth rate of output per worker before the change? What happens to this growth rate...
A:
Q: What does the U.S. government call its policy of tax breaks for research and development? Select the...
A: The US government call it's policy of tax breaks for research and development as the Research and De...
$6 per unit tax imposed on the buyers means that the buyers will pay $6 more than what the sellers will receive. So if sellers receive Ps and buyers pay Pb,
Pb=Ps+t
Now we see that Pb and Ps denote the inverse demand and inverse supply curves respectively. So, to find the new equilibrium, we have to move the supply curve up by $6.
Trending now
This is a popular solution!
Step by step
Solved in 2 steps
- During a discussion several year; ago on building a pipeline to Alaska to carry natural gas, the U.S. Senate passed a bill stipulating mat there should be a guaranteed minimum price for the natural gas that would flow through line pipeline. The thinking behind the bill was that if private firms had a guaranteed price for their natural gas, they would be more willing to drill for gas and to pay to build the pipeline. Using the demand and supply framework, predict the effects of this price floor on fine price, quantity demanded, and quantity supplied. With the enactment of this price floor for natural gas, what are some of the likely unintended consequences in line market? Suggest some policies other than the price floor that he government can pursue if it wishes to encourage drilling for natural gas and fur a new pipeline in Alaska.Demand for cookies is of the following form: P=20-4QD, where QD is millions of cookies demanded per year and P is price in US dollars. Supply of cookies of the following form: P=6+Qs, where QS is millions of cookies supplied per year and P is price in US dollars. a. What is the equilibrium quantity of cookies traded? Solve the equation, showing your work. b. Graph the supply and demand curves, marking their intersection. Be sure to label intercepts, equilibrium, etc. c. The government imposes a tax of $2 per cookie on producers of cookies. What is the new equilibrium quantity of cookies traded? Solve the equation, showing your work. d. In a graph, show how the supply curve has shifted. What price do consumers now pay? After paying the tax, how much to producers receive.Chapter 2 Problem #5. Suppose the demand and supplycurves for a product are given by QD= 500 −2PQS=−100 + 3Pa. Graph the supply and demand curves.b. Find the equilibrium price and quantity.Qd= Q3500-2P= -100+3PP= Pe = 120 & Qe=260The equilibrium price is $120 and the quantity is 260c. If the current price of the product is $100, what is thequantity supplied and the quantity demanded? How would you describe thissituation, and what would you expect to happen in this market?d. If the current price of the product is $150, what is thequantity supplied and the quantity demanded? How would you describe thissituation, and what would you expect to happen in this market?e. Suppose that demand changes to QD= 600 â 2P.Find the new equilibrium price and quantity, and show this on your graph.***PLEASE SHOW ALL EQUATIONS AND METHODS,
- I would like to know just part d,e, and f. Thank you Suppose that the supply of tomato soup in a city is represented byQS = 100P – 10PT − 50where P is the price of tomato soup and PT is price of tomato needed to produce tomato soup. All prices are indollars and quantity is in liters.Assume that the current tomato price is $15.Suppose that the demand for the tomato soup is QD = 1000−60P + 0.3Iwhere P is the price of the tomato soup and I is a representative household’s income.Assume that at the equilibrium, income is $12000.a) What are the current equilibrium price and quantity of the tomato soup? Show the equilibrium on a detailedgraph.b) Suppose that income decreases to $10400. What is the new equation for the demand for tomato soup? Doesthis correspond to an increase or decrease in the demand for tomato soup? Show the effect of this event onthe equilibrium and the diagram you used in part (a)c) Start from the equilibrium in part a) and now suppose that the price of the tomato…Suppose the government of the island has decided to give consumers a more attractive price for tomatoes by imposing a fixed, per unit subsidy. Thus, start with the original demand (Qd = 450 - 100P) and supply (Qs = 50P) and analyze this new intervention, the subsidy. The subsidy works like this: each tomato seller receives a 3-dollar refund for each kilogram of tomatoes sold. Write down the equation for the new "effective supply" curve. Determine the new equilibrium quantity and equilibrium price. What is the price that the consumers will pay for their tomatoes? What is the price that the producers will effectively earn for their tomatoes, inclusive of the subsidy? How much will the government spend on tomato subsidies in this case in total? (Recall the units of measurement: P is the price in dollars per kilogram of tomatoes; and Q is the quantity of tomatoes, expressed in thousands of kilograms.) Graphically depict the new equilibrium complete with (solved) values for the new…In 2018, a cold front in Barbados increased both the demand for water heaters andgasolines. The usage of gasoline was 581 tonnes, an increase from 499 tonnes in theprevious year. The Petroleum Company of Barbados advised Government officials thatdemand could outweigh supply and asked companies to increase the supply. They alsoasked major gasoline users, such as power plants, to reduce demand.i. Illustrate the effect of the cold front on the demand for gasoline using a demandcurve diagram over the two years. ii. Assuming the Petroleum Company of Barbados did not issue a directive for anincrease in supply and a decrease in demand, explain the problem that would existin the economy and how would this be corrected over time. iii. Illustrate the effect of major gasoline suppliers increasing supply as well as usersreducing their demand. iv. Discuss one factor EACH that you think influence demand and supply for waterheaters. Provide examples v. Is demand for gas is price elastic or price…
- In 2018, a cold front in Barbados increased both the demand for water heaters andgasolines. The usage of gasoline was 581 tonnes, an increase from 499 tonnes in theprevious year. The Petroleum Company of Barbados advised Government officials thatdemand could outweigh supply and asked companies to increase the supply. They alsoasked major gasoline users, such as power plants, to reduce demand. i. Illustrate the effect of the cold front on the demand for gasoline using a demandcurve diagram over the two years. ii. Assuming the Petroleum Company of Barbados did not issue a directive for anincrease in supply and a decrease in demand, explain the problem that would existin the economy and how would this be corrected over time.Consider a hypothetical market for copper (q), where q is measured in 1000 tons. Suppose the supply of virgin copper is Sv = 10+5q. Suppose that the supply for recycled copper is Sr = 15+2.5q. Demand for copper is P = 65 – 1.5q. Note, buyers don’t distinguish between recycled and virgin copper. a. Draw a graph that illustrates these supply and demand conditions. b. What will the equilibrium output level of copper be in this market? What will the equilibrium price be? How much of this copper will be recycled? Label these values on your graph in part a. Note:- Do not provide handwritten solution. Maintain accuracy and quality in your answer. Take care of plagiarism. Answer completely. You will get up vote for sure.Suppose that the annual demand and supply curves for some good in a competitive market are QD = 26 – 2P and QS = −2 + 2P a: Solve for the equilibrium quantity and price.b: Neatly graph this market, showing the horizontal and vertical intercepts of the demand curve,the vertical intercept of the supply curve, and the equilibrium. Make sure to put quantity on the horizontalaxis.
- ** I have the answer to the equation, I just am unsure of how to go about plotting the graph. Thank you! ** Suppose that a market analysis shows that the demand and supply equations for the market are as follows: Qs=8P; QD=336-6P. Find the equilibrium price and quantity in this market. Now, using graph paper, plot the supply and demand curves carefully and verify that the curves intersect at the equilibrium price and quantity that you found. On your graph, be sure to label your axes and clearly indicate the price and quantity intercept values.Consider the market for minivans. For each of theevents listed here, identify which of the determinantsof demand or supply are affected. Also indicatewhether demand or supply increases or decreases.Then draw a diagram to show the effect on the priceand quantity of minivans.a. People decide to have more children.b. A strike by steelworkers raises steel prices.c. Engineers develop new automated machineryfor the production of minivans.d. The price of sports utility vehicles rises.e. A stock market crash lowers people’s wealth.In 2018, a cold front in Barbados increased both the demand for water heaters andgasolines. The usage of gasoline was 581 tonnes, an increase from 499 tonnes in theprevious year. The Petroleum Company of Barbados advised Government officials thatdemand could outweigh supply and asked companies to increase the supply. They alsoasked major gasoline users, such as power plants, to reduce demand. Illustrate the effect of the cold front on the demand for gasoline using a demandcurve diagram over the two years.