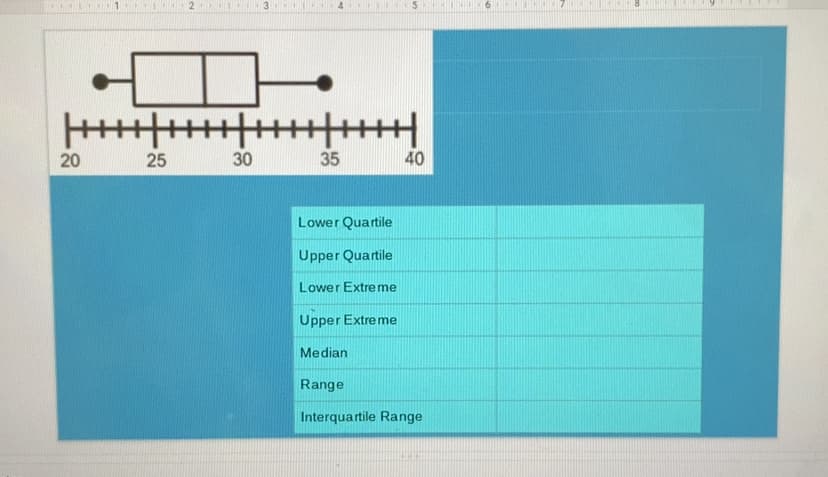
20 25 30 35 40 Lower Quartile Upper Quartile Lower Extre me Upper Extre me Median Range Interquartile Range


Q: Approximate the measures of center for following GFDT. Data Frequency 40-44 2. 45-49 50 -54 15 55-59…
A: Mean: The mean is the sum of observations divided by the number of observations. that is,Mean =…
Q: Contem x CDC HPV Infe X Where d X S Does Ea X Does Ea X V My Citat X Human…
A: Find the standard error of the following. Formula to find standard error isSE=σn
Q: mathematical operations
A: The four major forms of measurement have the following hierarchy, with the ratio scale being the…
Q: 4+ て 3 4 3. 6 8 4 8 6 59 4. 4. 9. て 3.
A: Given data in leaf-plot is…
Q: Using the following data: 5 5 6 8 8 9 10 10 12 15 16 19 20 20 21 24…
A: It is given that number of observations in the data set (n) is 20.
Q: Attached is the dataset: 17) Looking at the graph on Pupal Mass vs Development Time, what type of…
A:
Q: An article reported on a long-term study of the effects of hurricanes on tropical streams of a…
A:
Q: Data 24 132 156 95 57 173 155 45 134 Question1 xbar Question 2 Question 3 medan median Click to…
A: The xbar for the given data in the question represents the mean of the data.The formula to calculate…
Q: Question: A contractor want to select a steel bars (diameter 16 mm) produced from two factories (A…
A: Since you have posted a question with multiple subparts we will solve first three subparts for you.…
Q: 아 3 4 5 6. c1 Center: Mean: Median: Variation: St. Dev.: Range: 5-Number Summary: Min.: Q1: Q2: Q3:…
A: The given Dot-plot shows data values with their frequencies S.No. Data value frequency 1 2 3…
Q: Approximate the measures of center for following GFDT. Data Frequency 40 - 44 45 - 49 50 - 54 13 55…
A: Solution: To find: 1.Mode 2.Median 3. Mean
Q: Example 5. Compute Inter Quartile Range, Coefficient of Quartile Deviation and Percentile Range for…
A:
Q: 8:53 Done ohm.lumenlearning.com AA C Here is a FDT for a small data set: data freq 42 3 43 3 44 3 45…
A: Mean = 33 Mode = 8 Midrange = 44
Q: + + + 20 21 22 23 24 25 26 27 28 29 Find these landmarks for this data set. Median: 23 O If Ms. Li…
A: In the first question, the number of students is not mentioned. So, that is incomplete. We are…
Q: (a) Provide a point estimate of the population mean number of weeks it takes a worker aged 55 plus…
A: X (x-xbar)^2 21 1 14 64 51 841 16 36 17 25 14 64 16 36 12 100 48 676 0 484 27…
Q: A researcher is exploring the relationship of academic performance of students in an online class to…
A: Given the data as ID Academic performance Digital literacy Score Speed of internet connection…
Q: Lovely Lawns, Inc., intends to use sales of lawn fertilizer to predict lawn mower sales. The store…
A: Introduction: We have renamed the predictor variable, Fertilizer Sales as x, and the response…
Q: 8. 6 1 16 21 data 26 31 Based on the histogram above, what is the frequency of the class containing…
A:
Q: Here's the Five Number Summary 1. Minimum: 2 2. Мaximum: 8 3. First quartile (Q,/ 25" Percentile): 4…
A: Five number summary consists of minimum, first quartile, median, third quartile and maximum.
Q: nges and continue working later, or click Cancel to quit without saving changes. Cancel Save Draft…
A: Box and whisker plot: A type of graph used to display patterns of quantitative data is called a…
Q: Consider the boxplot below. 18 36 50 61 10 60 70 30 20 data 40 50 a. What quarter has the largest…
A: Solution: Note: Hello! As you have posted more than 3 sub parts, we are answering the first 3…
Q: 15 22 12 21 26 18 42 29 64 20 15 22 18 24 27 24 26 19 a. Compute the mean and median percentage of…
A: As per Guidelines we are suppose to do only three subparts
Q: 20 22 24 26 28 30 32 34 Lower Quartile Upper Quartile Lower Extreme Upper Extreme Median Range…
A: Lower Quartile= 22 Upper Quartile = 27 Lower Extreme = Minimum = 20 Upper Extreme = Maximum = 30
Q: 6. 10 11 12 13 14 15 16 data Based on the boxplot above, identify the 5 number summary (min, Q1,…
A:
Q: People with diabetes must monitor and control their blood glucose level. The goal is to maintain…
A: Given data, 162 114 80 152 145 163 75 85 188 234 233 113 311 174 80 168 154 320 To find,…
Q: 15 18 10 12 16 2 6. 19 10 6. 2. 0. 15 19 14 4. 20 18 7. Sorted Data Minimum Quartile 1 Median…
A:
Q: Nursery specializes in custom-designed landscaping for residential areas. The estimated labor cost…
A: Since you have posted question with multiple subparts,we will solve first three subparts for you.To…
Q: A tuatara is a reptile that is endemic to New Zealand and the sole surviving species of its order…
A: Solution is given below.
Q: Good forecasting and control of preconstruction activities leads to more efficient use of time and…
A: Hey there! Thank you for posting the question. Since your question has more than 3 parts, we are…
Q: yA 45 40 35 30 25 20 15 10 0 5 10 15 20 25 30 35 40 x 12 The data show relationship. Outlier(s):…
A: Given that the graph. To find the relationship of the graph.
Q: Joan's Nursery specializes in custom-designed landscaping for residential areas. The estimated labor…
A: a. The null and alternative hypothesis is written as: H0:u=2Ha:u≠2 It should be two tailed. b The…
Q: Find the following measures of dispersion for the data below: 2 6 16 11 2 16 4 13 17 20 18 2 4 9. 13…
A: The sorted data is given as: 2 2 2 3 4 4 6 6 7 8 9 11 11 13 13 14…
Q: 11 18 24 33 47 59 61 72 (1) Find Quartile 2 (2) Percentile 50
A: Given data, 11,18,24,33,47,59,61,72 Sort the data in ascending order 11,18,24,33,47,59,61,72
Q: Maaa A. USing the data given beoW SUlve Por 1. Mean 2. Median 3. MOde tf C.I. 131-135 126- 130…
A: Given: The provided data is: Class Interval Frequency(f) Mid point (x) d=x-Ah f.d cf 131 - 135…
Q: 15 20 25 30 35 40 45 Age in years Use the boxplot to complete the 5-number summary. Minimum Qi…
A: Given :- 15, 20, 25, 30, 35, 40, 45 now, a. minimum =15 b. Quartile 1 Q1 = median of the…
Q: Find the measures of center for following. Data Frequency 50 - 54 55 - 59 60 - 64 11 24 15 65 - 69…
A:
Q: 9th Grade 10th grade 11th grade 12th grade 6…
A: mean square within group = 80.3995
Q: The box-and- magazine subscriptions sold by E 6. 8. 10 12 14 16 18 20 Which statistical measures do…
A: A Box plot is a method for graphically depicting groups of numerical data through their quartiles .…
Q: Masks were required to be worn at Jim's Grocery Store during the COVID-19 pandemic. During each…
A: Solution Given data represents the number of times the mask rule was violated
Q: School X School Y 1. 3. Number of Years Teachers Have Been Teaching 5. 7. 2 4 6 8 What is the median…
A: The comparative boxplot is employed to contrast different collections of information pertaining to…
Q: Group 2 wieght gender 2. 37 37 37 40 2 40 40 43 Group 1 wieght 50 50 55 58 gender 2 45 45 1 1. 45 46…
A:
Q: 21 14 51 16 17 14 16 12 48 0 27 17 32 24 12 10 52 21 26 14 13 24 19 28 26 26 10 21 44 36 22 39 17 17…
A:
Q: Range 11 7 IQR 7 4 MAD 4 2 Part A Compare the measures of center of the data sets. Part B Compare…
A: Measure of centre for given data set are Mean Median Measure of variability are Range IQR MAD
Q: The following Levey-Jennings Chart indicates: * CONTROL 220 215 - 210 +2 SD 205 - 200 mean 195 190…
A: Solution: A Levey-Jennigs Chart is given.
Q: Consider the boxplot below. 23 40 50 66 84 20 30 40 50 60 70 80 90 data a. What quarter has the…
A:
Q: Treatment N Mean Median Minimum control 60 1.1737 1.1600 .65 3dS 60 1.0043 .9600 .67 6dS 60 .9160…
A: Mean is the average measure of the observation. It is the type of measure of central tendency. It is…
Q: Which of the following statements about descriptive analysis is FALSE? * for most projects,…
A: Given four statements about descriptive analysis. 1. for most projects, statistical analysis begins…

Step by step
Solved in 2 steps


- Suppose 24% of students at Florida University are business students. Of those, 28% are Econ majors.What percent of Florida University students are Econ majors? Round your answer to three decimal places.Engr. Dacara is given a load to teach Work Study and Measurement to his IE class. During the first meeting of the semester, he targeted to deliver a total of 54 home activities will be allocated for each student enrolled to accomplish the 18-week semester from February to June. a. How many home activities should each student finish per week to meet the deadline? b. Due to delays on enrollment and other factors, 33.33% of the semester time was lost. What will be the new set-up for each student to finish to meet the deadline?Apportionmentl. Two hundred new medicine board passer will be assigned in the different provincial hospitals of the different regions. Data of the hospitals as follows. Apportion the doctors in the different hospital by using Hamilton and Jefferson Plan to justify the answer. Show solution. RegionalHospital Bed capacityRegion 1 75Region 2 105Region 3 250NCR 400Region 4 162Region 5 134
- If the mortality rate under one month infants in a country is 2.5 per thousand, and the same rate for infants up to two months is 6 per thousand: A) What is the approximate mortality rate of 1000 infants in the second month of life? B) What is the probablity that 2500 babies born in that country in one day will reach one month old?According to http://www.gasandoil.com/goc/news/ntl50398.htm , accessed on Feb 2, 2005, “17-12-04 Jamaica has found signs of oil in 10 exploratory wells drilled into deep underground structures. Now it's come to Houston looking for oil companies willing to help the island nation, which depends heavily on tourism, bauxite and alumina, to become the world's next oil and natural gas producer. Hopeful Jamaican officials traveled to Houston promoting the nation's first formal license round, offering 22 offshore blocks and four on-shore blocks. "There are plenty of reserves yet to be found -- exploration in new frontiers is now warranted," said Raymond Wright of the Petroleum Corporation of Jamaica, reflecting on the world's supply dilemma. Oil explorers order seismic tests to determine whether oil is likely to be found in a certain drilling area. These seismic tests have a known reliability: When oil exists the tests indicate so 85% of the time and when oil does not exist the…A municipal solid-waste site for a city must be located at Site A or Site B. After sorting, some of the solid refuse will be transported to an electric powerplant where it will be used as fuel. Data for the hauling of refuse from each site to the power plant are shown in Table P2-4. If the power plant will pay $8.00 per cubic yard of sorted solid waste delivered to the plant, where should the solid-waste site be located? Use the city’s viewpoint and assume that 200,000 cubic yards of refuse will be hauled to the plant for one year only. One site must be selected.
- A population of 200 healthy men was followed up for the development of prostate cancer. 10 men were followed-up for 1 year and were then lost to follow-up. After being followed-up for 5 years, 10 men developed prostate cancer. The remaining men who never developed prostate cancer were followed for 10 years. Calculate the total number of person years of observation accrued by this populationA report in LTO stated that the average age of taxis in the Philippines is 9 years. An operations manager of a large taxi company selects of 40 taxis and finds the average age of the taxis is 8.2 years. The of the population is 2.3 years. At can it be concluded that the average age of the taxis in his company is less than the national average?It has been suggested that daily production of a subassembly would be increased if better lighting were installed and background music and free coffee and doughnuts were provided during the day. Management agreed to try the scheme for a limited time. A listing of the number of subassemblies produced per week before and after the new work environment for each employee follows. Employee Past Production Record Production after Installing, Lighting, Music, etc. JD 23 33 SB 26 26 MD 24 30 RCF 17 25 MF 20 19 UHH 24 22 IB 30 29 WWJ 21 25 OP 25 22 CD 21 23 PA 16 17 RRT 20 15 AT 17 9 QQ 23 Show your work, please. Thanks!
- It has been suggested that daily production of a subassembly would be increased if better lighting were installed and background music and free coffee and doughnuts were provided during the day. Management agreed to try the scheme for a limited time. A listing of the number of subassemblies produced per week before and after the new work environment for each employee follows. Employee Past Production Record Production after Installing, Lighting, Music, etc. JD 23 33 SB 26 26 MD 24 30 RCF 17 25 MF 20 19 UHH 24 22 IB 30 29 WWJ 21 25 OP 25 22 CD 21 23 PA 16 17 RRT 20 15 AT 17 9 QQ 23 30 FIND: State the decision rule and show your work: Reject H0 if T ≤ : Compute T and arrive at a decision (Show your work). T = ____________ , do not reject H0.A 13-year-old, M/N Golden Retriever named Chaska (45 kg) has not been able to bear weight on his rear limbs for the past 2½ days. The owner was given both surgical and medical options, but because of the dog’s age, the owner opted for medical treatment. This dog was put on carprofen 1 mg/lb BID. Before treatment was started, a blood sample was collectedto assess liver enzymes. Carprofen comes in 25 mg, 75 mg, and 100 mg tablets. Calculate the amount of medication needed for 14 days of treatment.a. How many tablets do you dispense to this owner?In a geographical location with a mid-year population of 1,000,000 (1 million) there were 1125 deaths during an entire year due to all causes combined.Out of those 1125 deaths, 185 deaths were due to causes related to pregnancy and 165 deaths were among children less than one-year old. There were 650 live births that year in that location. Please select the correct option(s) from the following. a. The maternal mortality ratio was 25 per 100 live births b. Infant mortality was 17 per 100,000live births c. The infant mortality was 254 per 1,000 live births d. The maternal mortality was 285 per 1,000 live births


