2016 2,500 125 190 2017 Cell phones produced and shipped Number of defective units shipped Number of customer complaints Units reworked before shipping Manufacturing cycle time Average customer-response time 10,000 400 250 150 13 days 28 days 700 14 days 26 days 1. For each year, 2016 and 2017, calculate the following: a. Percentage of defective units shipped b. Customer complaints as a percentage of units shipped c. Percentage of units reworked during production d. Manufacturing cycle time as a percentage of total time from order to delivery 2. Referring to the information computed in requirement 1, explain whether WCP's quality and timeliness have improved. Required
2016 2,500 125 190 2017 Cell phones produced and shipped Number of defective units shipped Number of customer complaints Units reworked before shipping Manufacturing cycle time Average customer-response time 10,000 400 250 150 13 days 28 days 700 14 days 26 days 1. For each year, 2016 and 2017, calculate the following: a. Percentage of defective units shipped b. Customer complaints as a percentage of units shipped c. Percentage of units reworked during production d. Manufacturing cycle time as a percentage of total time from order to delivery 2. Referring to the information computed in requirement 1, explain whether WCP's quality and timeliness have improved. Required
Cornerstones of Cost Management (Cornerstones Series)
4th Edition
ISBN:9781305970663
Author:Don R. Hansen, Maryanne M. Mowen
Publisher:Don R. Hansen, Maryanne M. Mowen
Chapter14: Quality And Environmental Cost Management
Section: Chapter Questions
Problem 4CE: Nabors Company had actual quality costs for the year ended June 30, 20x5, as given below. At the...
Related questions
Question
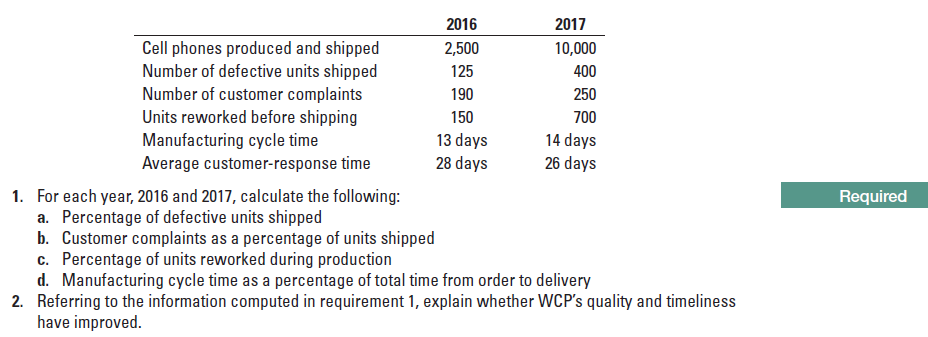
Nonnancial measures of quality and time. For the past two years, Worldwide Cell Phones (WCP) has been working to improve the quality of its phones. Data for 2016 and 2017 follows (in thousands of phones):

Transcribed Image Text:2016
2,500
125
190
2017
Cell phones produced and shipped
Number of defective units shipped
Number of customer complaints
Units reworked before shipping
Manufacturing cycle time
Average customer-response time
10,000
400
250
150
13 days
28 days
700
14 days
26 days
1. For each year, 2016 and 2017, calculate the following:
a. Percentage of defective units shipped
b. Customer complaints as a percentage of units shipped
c. Percentage of units reworked during production
d. Manufacturing cycle time as a percentage of total time from order to delivery
2. Referring to the information computed in requirement 1, explain whether WCP's quality and timeliness
have improved.
Required
Expert Solution
This question has been solved!
Explore an expertly crafted, step-by-step solution for a thorough understanding of key concepts.
This is a popular solution!
Trending now
This is a popular solution!
Step by step
Solved in 5 steps with 11 images

Knowledge Booster
Learn more about
Need a deep-dive on the concept behind this application? Look no further. Learn more about this topic, accounting and related others by exploring similar questions and additional content below.Recommended textbooks for you

Cornerstones of Cost Management (Cornerstones Ser…
Accounting
ISBN:
9781305970663
Author:
Don R. Hansen, Maryanne M. Mowen
Publisher:
Cengage Learning

Survey of Accounting (Accounting I)
Accounting
ISBN:
9781305961883
Author:
Carl Warren
Publisher:
Cengage Learning

Cornerstones of Cost Management (Cornerstones Ser…
Accounting
ISBN:
9781305970663
Author:
Don R. Hansen, Maryanne M. Mowen
Publisher:
Cengage Learning

Survey of Accounting (Accounting I)
Accounting
ISBN:
9781305961883
Author:
Carl Warren
Publisher:
Cengage Learning