2017 2016 Sales revenue $3.940 $3,600 Costs and expenses Cost of goods sold 1,055 990 Selling & administrative expenses 2400 2,330 Interest expense 25 20 Total costs and expenses 3.480 3,340 Income before income taxes 460 260 Income tax expense 136 76 Net income $ 322 $ 182


Q: The following information was available for the year ended December 31, 2015 $300,000 210,000 15,000…
A: SOLUTION- Accounts receivable (AR) is the balance of money due to a firm for goods or services…
Q: 2015 2016 Sales 700 Cost of sales 500 Gross profit 200 Operating expenses 40 Net income 160…
A: The income statement is prepared to find the net income or loss incurred during the period.
Q: TLC Company Comparatiove Statement of Comprehensie Income For Year 2015 and 2016 2016 2015 Net Sales…
A: Ratio analysis is the one of the important technique of management accounting. Under this, various…
Q: 7A. The Net profit percerntage to revenue is ___________ . 25.15% 16.67% 12.15% 20.55% 7B. The…
A: solution concept net profit margin =net profit / revenue gross profit margin…
Q: 5. You are given ratios and amounts for X company for 2016 Current ratio 2.7 Quick ratio Inventory…
A: Accounting ratios or financial ratios are useful in obtaining information regarding the company's…
Q: The following balances are taken from the Statement of Comprehensive Income of JR Bellen Trading.…
A: Income statement: It refers to a financial statement that presents all the income earned by the…
Q: Smith and Sons, Inc. Income Statement (in millions) 2016 2015 Net sales 10,500 10,000 Cost of goods…
A: Times interest earned ratio: Times interest ratio is a financial measure which shows the number of…
Q: Net Sales Revenue Cost of Goods Sold Average Inventory 2017 $ 5,430 4,100 765 2018 $ 6,080 4,580 880
A: Formula: Inventory turnover ratio = Cost of goods sold / Average inventory Division of Average…
Q: Complete the common-size income statement below: Common-Size Income Statement 2016 Revenues $ 29,970…
A: Formula: Formula: Revenues % = ( Revenues value / Revenues value ) x 100
Q: Net income. $ 52,250 Sales (all on credit). 295,000 Cost of goods sold.. 123,000. Interest expense.…
A: Average Inventory = Opening Inventory + Closing Inventory 2…
Q: The following data relate to Alpha Company: 2018 2017 P500,000 P400,000 240,000 200,000 Sales Cost…
A: Comparative Financial statements or also called horizontal analysis are used to compare the item of…
Q: Cullumber Appliances Corporation has reported its financial results for the year ended December 31,…
A: Liquid Ratio: These ratios help in finding the liquidity of the company, which means how much the…
Q: ACTIVITY 2014 2015 Horizontal Vertical Analysis Analysis Revenue 1,939,500 1,674,675 1- 7. Cost of…
A: Horizontal analysis is that financial statement analysis under which increase or decrease from…
Q: BALANCE SHEET INCOME STATEMENT Current Assets: 2017 2018 2018 Cash $ 143,000 $ 154,775 $ 178,000 $…
A: Free cash Flows refers to Net cash flow from Operating Activities less Capital Expenditure. It is…
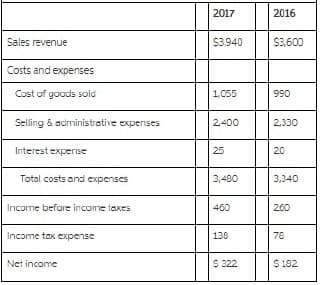
Q: 2017 2016 Sales revenue S3.940 $3,600 Costs and expenses Cost of goods sold 1,055 990 Selling &…
A: Answer) Calculation of Net Profit Margin for 2016 Net Profit Margin for 2016 = Net Income for 2016/…
Q: 8. Answer is D 9. Answer is C How do you get to these answers?
A: 1) Computation of no of day’s sales in inventory:
Q: Snow Pack Corporation is the biggest snowmobile manufacturer in the world. It reported the following…
A: Ratio analysis is used to evaluate the companies financial situation and compare the current…
Q: O'Conhor Company's income statement information for 2016 and 2017 (a sole proprietorship) is as…
A: Income Statement shows the net income or loss earned or incurred by the business during the…
Q: The following information is available for the Brown Company for 2016: Gross profit $30,000 Net…
A: Inventory: It refers to the items held by an organization which were in various forms like raw…
Q: Income Statement (2016) Credit Sales Cost of Goods Sold (800) Taxable Income Taxes (34%) Balance…
A: Income Statement (2016) Particulars Amount Credit Sales 1000 Cost of Goods Sold (800)…
Q: A. Cost of goods sold is 48.57% of net sales for 2017 B. Net Sales increased $80 000 or 33.63%…
A: Analysis of financial statement means to find out the various relation between different interlinked…
Q: ounts payable turnover and days' payable outstanding (DPO) for 2017 and 2018. tio 20400 Data Table…
A: Ratio analysis is a method of measuring the financial position of the organization with different…
Q: Abakada Trading Company are given below: 2014 2015 Revenue 1,939,500 1,674,675 Cost of Goods Sold…
A:
Q: Brick & Stone Income Statement for the year ended 31 December 2016 Notes $ $ Sales 2,500,000 Cost of…
A: Particualrs Debit Credit Sales 2500000 Cost of sale 1100000 Less: Goods used for personal…
Q: LOGIC COMPANY Comparative Income Statement For Years Ended December 31, 2017 and 2018…
A: Ratio analysis is a financial accounting technique to measure the overall performance and health of…
Q: Common-Size Income Statement 2016 Revenues $ 29,970 % Cost of goods sold Gross profit Operating…
A: Common size analysis means where each item of balance sheet is expressed in form of percentage and…
Q: Common-Size Income Statement 2016 Revenues $ 29,970 % Cost of goods sold (20,030) $ 9,940 Gross…
A: Common Size Income Statements are presenting Income Statements in a way in which all the revenues…
Q: The following information is taken from Allen Corporation's fiscal 2016 annual report. Selected…
A: Cost of goods sold = Opening balance of inventory + Purchases during the period - Closing balance of…
Q: LOGIC COMPANY Comparative Income Statement For Years Ended December 31, 2017 and 2018…
A: What is meant by ratio analysis? An analysis of the financial statement carried out to have an…
Q: A company reported the following data for the year ending 2018: Description Amount Sales Sales…
A: Gross profit is a profit that a company makes after deducting the cost associated with making and…
Q: 2014 2013 Revenue $14,147,293 $13,566,296 Cost of goods sold $-8,447,560 $-8,131,586 Selling,…
A: Definition: Day's sales in inventory: This ratio tells the number of days company takes to sell its…
Q: 10: Application of Financial Ratios Used to Measure Profitability The income statement of Garnet…
A: Profitability for any company can be ascertained or determined through these financial ratios :…
Q: Required: Solve for the missing items in the partial income statements given below: E9-8 2015 2016…
A: Formula: Net Sales = Sales - Sales returns and allowances
Q: Name: Income Statement…
A: Growth between two years in Income statement means how much sales, other expense and income are…
Q: Dolfin Corporation Income Statement For the Year Ended December 31, 2017 1 Sales $319,340.00 2…
A: The income statement is one of the essential parts of the financial statements used for reporting…
Q: Van der Man Fashions, Inc. Income Statement Years Ended December 31, 2018 and 2017 2018 2017 236,000…
A: Average accounts = ( Previous year account + Current year account ) / 2 So , Average inventory = (…
Q: BCD Co Financial Statements Income Statement for the year ended 31 December 2020 RM (mil.) RM…
A: Cash flow statement The purpose of preparing the cash flow statement is to know know the net cash…
Q: Comparative income statement for Deep Sea Company for 2016 and 2015 are given below…
A:
Q: Assume that for the 2017 fiscal year, AstroCo reported sales revenue of $3.4 billion and cost of…
A: Ratio analysis helps to analyze the financial performance of the company. The management can take…
Q: Computing asset turnover ratio Blackerby Photo reported the following figures on its December 31,…
A: Formula to calculate asset turnover ratio: Asset turnover = Net sales / Average assets
Q: 2015-2019 Financial Statement Data and Stock Price Data for Mydeco Corp. (All data as of fiscal year…
A: Revenue: Revenue is the amount earned by the company by selling the goods or providing the services…
Q: 2018 2017 912,000 Dtal relenue expenses. osts of goods sad ellinglgineial expenus a3a,000…
A: Formula: Amount Increase or decrease = 2018 Amount - 2017 Amount

Step by step
Solved in 2 steps


- INCOME STATEMENT Year ended June 30 2022 2021 $'000 $'000Revenue 22450 18675Cost of sales 8475 8055Gross Profit 13975 10620Distribution costs 4245 3120Administrative expenses 1276 2134Selling expenses…2014 2013 Revenue $14,147,293 $13,566,296 Cost of goods sold $-8,447,560 $-8,131,586 Selling, general, andadministrative expenses $-998,843 $-980,283 Depreciation $-1,497,919 $-1,472,544 EBIT $3,202,971 $2,981,883 Interest expense $-376,259 $-355,627 Taxes $-1,074,151 $-997,977 Net income $1,752,561 $1,628,279 Right-click on the table and select Copy to Clipboard and then right-click the highlighted texts in the popup dialogue box and select Copy in order to paste its contents into a spreadsheet. Tyler Toys, Inc. Balance Sheet as of December 31, 2013 and 2014 ASSETS 2014 2013 LIABILITIES 2014 2013 Current assets Current liabilities Cash $191,068 $187,833 Accounts payable $1,546,427 $1,455,115 Investments…Use the below information to answer the following questions: 20202021Sales$11,573$12,936Depreciation 1661 1736Cost of goods sold 3979 4707Other Expenses 846 924Interest Expense 776 926Cash 6067 6466Accounts Receivables 8034 9427Short-term Notes Payable 1171 1147Long-term debt 20,320 24,696Net fixed assets 50,888 54,273Accounts Payable 4384 4644Tax rate 26% 34%Inventory 14,283 15,288Payout ratio 33% 30% A. Create the Balance Sheets for 2020 & 2021.
- Use the below information to answer the following questions: 20202021Sales$11,573$12,936Depreciation 1661 1736Cost of goods sold 3979 4707Other Expenses 846 924Interest Expense 776 926Cash 6067 6466Accounts Receivables 8034 9427Short-term Notes Payable 1171 1147Long-term debt 20,320 24,696Net fixed assets 50,888 54,273Accounts Payable 4384 4644Tax rate 26% 34%Inventory 14,283 15,288Payout ratio 33% 30% A. Create the Income Statements for 2020 and 2021 (including dividends paid and retained earnings).Use the following information (in thousands):a. ¥126,000 d. ¥63,000Answer:1Sales revenue¥300,000 Gain on sale of equipment90,000 Cost of goods sold164,000 Interest expense16,000 Selling & administrative expenses30,000 Income tax rate30%Determine the amount of net income.Comparative income statement for Deep Sea Company for 2016 and 2015 are given below: 2016 (in $) 2015 (in $) Revenue 1123420 876530 Cost of Goods Sold 635780 458790 Gross Profit 487640 417740 Selling and General Expenses 156870 110980 Operating Profit 330770 306760 Intrest Expense 45890 40980 Income Before tax 284880 265780 Income tax expense 97650 82340 Net profit 187230 183440 Answer the next set of questions based on the above data. 7A. The Net profit percerntage to revenue is ___________ . 25.15% 16.67% 12.15% 20.55% 7B. The Gross profit…
- What is the net income for the year if the net revenue from by-product is treated as deduction from the cost of goods sold? Group of answer choices d. P118,000 b. P230,000 a. P200,000 c. P218,000THE ATHLETIC ATTICIncome StatementFor the Year Ended December 31, 2024Net sales $8,900,000Cost of goods sold 5,450,000Gross profit 3,450,000Expenses: Operating expenses $1,600,000 Depreciation expense 210,000 Interest expense 50,000 Income tax expense 360,000 Total expenses 2,220,000Net income $1,230,000 THE ATHLETIC ATTICBalance SheetsDecember 31 2024 2023Assets Current assets: Cash $164,000 Accounts receivable 790,000 Inventory 1,405,000 Supplies 110,000Long-term assets: Equipment 1,150,000 Less: Accumulated depreciation (420,000) Total assets $3,199,000 Liabilities and Stockholders' Equity Current liabilities: Accounts payable $115,000 Interest payable 0 Income tax payable 40,000 Long-term liabilities: Notes payable 600,000 Stockholders' equity: Common stock 700,000…Comparative income statement for Deep Sea Company for 2016 and 2015 are given below 2016 ( in $) 2015 ( in $) Revenue 1123420 876530 Cost of Goods Sold 635780 458790 Gross Profit 487640 417740 Selling and general Expense 156870 110980 Operating Profit 330770 306760 Interest Expense 45890 40980 Income Before Tax 284880 265780 Income Tax expenses 97650 82340 Net Profit 187230 183440 Prepare the common size income statement of Deep Sea Company for 2016 and 2015. Enter the numbers without decimals. Do not round off the numbers. Add % sign after the numbers.…
- Use the following Income Statement and Balance Sheet Information for 2018 to answer the question below. This is a Retail Company. All numbers are in Millions. Income Statement Total Sales213.8 Cost of Sales151.3 Gross Profit213.8-151.3 Selling and Administrative Expenses22.3 Research and Development 7.7 Depreciation and Amortization4.5 Other Income2.4 EBIT213.8-151.3-22.3-7.7-4.5+2.4 Interest Expense5.8 Pretax Income213.8-151.3-22.3-7.7-4.5+2.4-5.8 Taxes( 213.8-151.3-22.3-7.7-4.5+2.4-5.8 )*0.30 Net Income( 213.8-151.3-22.3-7.7-4.5+2.4-5.8 )*0.70 Balance Sheet Assets Liabilities Cash65.8Accounts Payable43.3Accounts Receivable54.4Notes Payable/Short term debt1.6Inventories4.4 Total Current Assets65.8+54.4+4.4Total Current Liabilities43.3+1.6 Net property, plant and equipment103.4Long-term debt80.0Total long-term assets103.4Total long-term debt liabilities80.0 Total Liabilities43.3+1.6+80.0 Stockholders' Equity (Total Equity)65.8+ 54.4+4.4+103.4-43.3-1.6-80.0Total…solve The Arc 95-9876556 Income Statement For the Year Ended December 31, 2021 Revenue: Gross Sales $144,000.00 Less: Sales Returns and Allowances - Net Sales $144,000.00 Cost of Goods Sold: Beginning Inventory $10,500.00 Add: Purchases 62,200.00 $72,700.00 Less: Ending Inventory 10,100.00 Cost of Goods Sold 62,600.00 Gross Profit (Loss) $81,400.00 Expenses: Dues and Subscriptions - Estimated Federal Tax Payments 4,000.00 Estimated State Tax Payments 3,900.00 Insurance 3,950.00 Meals and Entertainment 1,500.00 Miscellaneous - Payroll Taxes 3,800.00 Professional Fees 1,700.00 Rent 8,400.00 Travel 1,250.00 Utilities 1,300.00 Vehicle Expenses - Wages 25,000.00 Total Expenses 54,800.00 Net Operating Income $26,600.00 How to calculate capital gain step by step answer"Keeper Corporation’s income statement for the year ended June 30, 2014, and its comparative balance sheets for June 30, 2014 and 2013 follow.Keeper CorporationIncome StatementFor the Year ended June 30, 2014Sales$234,000Cost of goods sold156,000Gross margin$78,000Operating expenses45,000Operating income$33,000Interest expense2,800Income before income taxes$30,200Income taxes expense12,300Net income$17,900Keeper CorporationComparative Balance SheetsJune 30, 2014 and 201320142013AssetsCash$69,900$12,500Accounts receivable (net)21,00026,000Inventory43,40048,400Prepaid expenses3,2002,600Furniture55,00060,000Accumulated depreciation—furniture(9,000)(5,000)Total assets$183,500$144,500Liabilities and Stockholders’ equityAccounts payable$13,000$14,000Income taxes payable1,2001,800Notes payable (long-term)37,00035,000Common stock, $10 par value115,00090,000Retained earnings17,3003,700Total liabilities and stockholders’ equity$183,500$144,500Keeper issued a $22,000 note payable for purchase of…