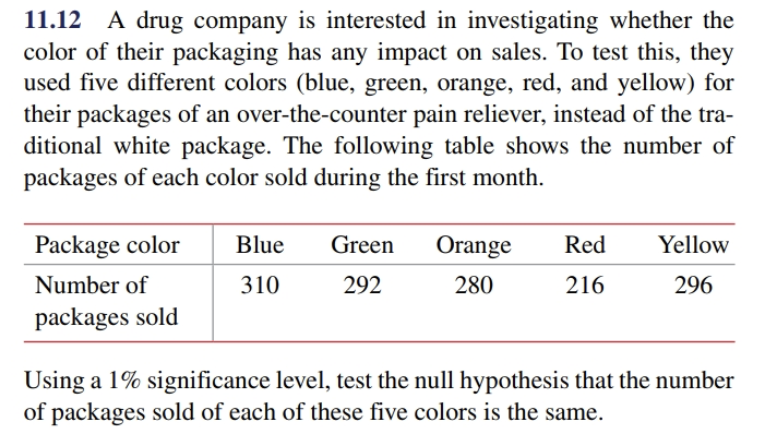
11.12 A drug company is interested in investigating whether the color of their packaging has any impact on sales. To test this, they used five different colors (blue, green, orange, red, and yellow) for their packages of an over-the-counter pain reliever, instead of the tra ditional white package. The following table shows the number of packages of each color sold during the first month Package color Blue Green Orange Red Yellow 216 Number of 310 292 280 296 packages sold Using a 1% significance level, test the null hypothesis that the number of packages sold of each of these five colors is the same


Q: 2 6. Investigate the association between eye colour of husbands and eye colour of wives from the…
A:
Q: Ackerman and Goldsmith (2011) found that students who studied text from printed hardcopy had better…
A: From provided information, claim is score for students using e-books were significantly different…
Q: 1. On the basis of her experience with clients, a clinical psychologist thinks that depression may…
A: The number of hours of sleep is recorded for depressed and normal patients as: Depressed Patients…
Q: Which of the following is true about an observational prospective cohort study being designed to…
A: Given information: It is given that an observational prospective cohort study is being designed to…
Q: Ackerman and Goldsmith (2011) found that students who studied text from printed hardcopy had better…
A: Given values, Calculate the sample standard deviation.
Q: No.of absences, x | 0 1 2 3 4 5 6 7 8 9
A: Let, x(Number of absences) = Independent variable y (Final grade) = Dependent variable
Q: 1. On the basis of her experience with clients, a clinical psychologist thinks that depression may…
A: For two population means (i.e., the true average hours of sleep for "depressed patients" and "people…
Q: Ackerman and Goldsmith (2011) found that students who studied text from printed hardcopy had better…
A: Hello! As you have posted more than 3 sub parts, we are answering the first 3 sub-parts. In case…
Q: 3) A undergraduate researcher wanted to know whether enzyme activity of mannose-6-phosphate…
A: ANOVA: The analysis of variance (ANOVA) is used to determine whether there are any statistically…
Q: weinstein, mcdermott and roediger 2010 report that students Who were giving questions to be answered…
A: From the provided information, The claim is that students who were giving questions to be answered…
Q: A manufacturing company designed a factorial experiment to determine whether the number of defective…
A: State the hypotheses Let Factor A denotes the Machine. Let Factor B denotes the Loading system.…
Q: Suppose that a study was conducted to determine if there is a significant difference in the average…
A: Solution: Let x= Temperature before getting booster y = Temperature after one day of getting…
Q: this study found that fourth year students at ONLINE UNIVERSITY Q had significantly higher salaries…
A:
Q: The following table was presented in a article summarizing a study to compare a new drug to a…
A: Given: The table presented in a article summarizing a study to compare a new drug to a standard drug…
Q: A sample of 77 individuals workings at the particular office was selected and rhe noise level…
A: To organize the data first make a frequency table. To make the frequency table first arrange the…
Q: In an experiment to determine which of the three different missile systems is preferable, the…
A:
Q: Students in QSO 510 are assigned to observe the effect of various types of music on relaxation mood…
A: Part a: Hypotheses: For Stages of Alzheimer’s: That is, there is no significant difference between…
Q: A study is being conducted to determine whether there is a relationship between jogging and blood…
A: For the given data Perform chi square test
Q: An experiment was designed to test for any significant differences in the time needed to perform…
A: An ANOVA is a statistical tool used to test the population mean of two or more than two groups.…
Q: The following histograms were derived using the same data on cycles to failure of aluminum test…
A:
Q: 3. It is claimed that a new diet will reduce a person's weight, on the average in a period of two…
A: In hypothesis testing, there is always two hypothesis. One of them is called the null hypothesis and…
Q: Ackerman and Goldsmith (2011) found that students who studied text from printed hardcopy had better…
A: Given: The overall average, μ= 81.7 The sample size, n = 9 The sample mean, M =…
Q: The following data were obtained to examine the effects of anxiety levels (low and high) and 3…
A: Two-way ANOVA: Analysis of Variance is known as ANOVA, it is a hypothesis testing to compare the…
Q: Which New Jersey universities have students with higher GPAs? A researcher compares the GPA of 20…
A: Use the given data to form the Anova table: Source Sum of squares Degree of freedom Mean square…
Q: A researcher is interested in investigating whether the military branch a person signs up for and…
A: The data is given by: O A B AB Army 97 67 43 12 Navy 108 70 50 17 Air Force 78 50 47 8…
Q: -For a population with µu = 70 and o = 8, what is the z-score corresponding to X = 82?
A:
Q: A study was conducted to explore workplace bullying in a community NHS trust. Staff were asked about…
A: 1. false P value < 0.001 means it is much less than 0.05 , so we reject null hypothesis. 2 false…
Q: A small study (n=10) is designed to assess if there is an association between smoking in pregnancy…
A: Given data of birth weights of babies born to mothers who reported smoking in pregnancy and those…
Q: 2. The article presents an assessment of the health outcomes of people working in an environment…
A:
Q: Prior to assessment of the outcome, the researchers did a manipulation check. Members of Groups 1…
A: It is given that the F-test statistic value is 184.29.
Q: 2. The article presents an assessment of the health outcomes of people working in an environment…
A: The question is about categorical data analysis using chi square test Given :
Q: 25. Suppose there is an experiment to compare fuel economics for two types of similarly equipped…
A: Given,n1=15 , x¯1=17 , s1=1n2=10 , x¯2=12 , s2=0.8
Q: Ackerman and Goldsmith (2011) found that students who studied text from printed hardcopy had better…
A: Solution : Given information: a) n= 9 sample size Degrees of freedom =df=n-1=9-1=8 M=77.2 Sample…
Q: Ackerman and Goldsmith (2011) found that students who studied text from printed hardcopy had better…
A: State the hypotheses That is, there is no evidence to conclude that scores for students using…
Q: 9. The following table gives the distribution of items of production and also the relatively…
A:
Q: Ackerman and Goldsmith (2011) found that students who studied text from printed hardcopy had better…
A: We have to test the claim that scores for students using e-books were sufficiently different from…
Q: The following data were obtained from a two-factor independent-measures experiment with n = 5…
A: Given information: The data corresponding to the two-factor independent-measures experiment with n =…
Q: For a study that had 40 total participants equally distributed among the 4 groups and an MSW of…
A: According to the provided data, the level of significance is 0.05, the number of groups is 4, total…
Q: Ackerman and Goldsmith (2011) found that students who studied text from printed hardcopy had better…
A: Given Information : Ackerman and Goldsmith (2011) found that students who studied text from printed…
Q: Ackerman and Goldsmith (2011) found that students who studied text from printed hardcopy had better…
A: Given Information : Ackerman and Goldsmith (2011) found that students who studied text from printed…
Q: Below is the incomplete summary table for an ANOVA. Source SS df MS F Factor A 420 ?…
A: Note: According to bartleby we have to answer only first three subparts please upload the question…
Q: Suppose a researcher conducting a follow up study obtains a sample of n = 25 students classified as…
A: Solution: Given information: n= 36 Sample size of overweight students M= 4.48 Sample mean of…
Q: Here is a stemplot of the percent of residents aged 25 to 34 in each of the 50 states: 11 44 Why did…
A:
Q: A 1980 study investigated the relationship between the use of OCs and the development of endometrial…
A: From the given information, Cancer No cancer Total OC Yes 6 8 14 OC No 111 387 498 Total…
Q: Ackerman and Goldsmith (2011) found that students who studied text from printed hardcopy had better…
A:
Q: A sociologist was hired by a large city hospital to investigate the relationship between the number…
A: Correct option is 2nd.
Q: 4. Consider the following data from a cross-sectional study to find association between yitamin D…
A:
Q: 3. During each of four experiments on the use of carbon tetrachloride as a worm killer, ten rats…
A: We want to test whether there are significant difference among the groups by using ANOVA table
Q: In a study of the effectiveness of physical exercise in weight reduction, a group of 12 persons…
A:


Trending now
This is a popular solution!

Step by step
Solved in 4 steps with 1 images

- Do well-rounded people get fewer colds? A study on the Chronicle of Higher Education was conducted by scientist at Carnegie Mellon University, the University of Pittsburgh and the University of Virginia. They found that people who have only a few social outlets get more colds than those who are involved in a variety of social activities. Suppose that of the 276 healthy men and women tested, n1=96 had only a few social outlets and n2=105 were busy with six or more activities. When these people were exposed to a cold virus, the following results were observed: Construct a 99% confidence interval for the difference in the two population proportions.31% of all pygmy softshell toises have stripes on their shells. A herpetologist in Cititon collects a sample of 28 pygmy softshell tortoises and finds that 8 of them have stripes on their shells. Is there enough evidence to conclude, at a significance of alpha=0.05, that the proportion of pygmy softshell tortoises in Cititon with stripes on their shells is less than 31%? What is the claim? What is the null hypothesis? What is the alternative hypothesis? What is the test statistic? What is/are the critical value(s)? Do we reject the null hypothesis? What conclusion do we draw? What is the P-value for the problem above?A sample of men and women who had passed their driver's test either the first time or the second time were surveyed, with the following results: Results of the driving testGender First time Second timeMen 126 211Women 135 178a) Do these data suggest that there is a relationship between gender and the passing of their driver’s test from which the present sample was drawn? Let alpha=.05
- Weinstein, McDermott, and Roediger (2010) report that students who were given questions to be answered while studying new material had better scores when tested on the material compared to students who were simply given an opportunity to reread the material. In a similar study, a group of students from a large psychology class were given questions to be answered while studying for the final exam. The overall average for the exam was m = 73.4 but the n = 16 students who answered questions had a mean of M =78.3 with a standard deviation of s = 8.4. Use a two-tailed test with a = .01 to determine whether answering ques- tions while studying produced significantly higher exam scores.Students in QSO 510 are assigned to observe the effect of various types of music on relaxation mood in patients who are in the early and middle stages of Alzheimer's disease at a certain Nursing Home facility. A number of patients were selected to participate in the study based on their stages of Alzheimer's disease. Three forms of music were tested: R&B, Blues, and Reggae. While listening to music, relaxation levels were recorded for the patients with a high score indicating a higher level of relaxation. Scores are recorded below. Group Reggae Blues R&B Early Stage Alzheimer's 2124221820 9121059 2926302426 Middle Stage Alzheimer's 2220251820 141811913 1518201319 Use Excel’s ToolPak to compute Two-Way ANOVA and submit your statistical output. Are there any significant main effects or an interaction effect? Interpret your answer.5.39 ● The following data on degree of exposure to 242Cmalpha particles (x) and the percentage of exposed cellswithout aberrations (y) appeared in the paper “Chromosome Aberrations Induced in Human Lymphocytes by D-TNeutrons” (Radiation Research [1984]: 561–573):
- Suppose the marketing research firm would like to examine if the social networking site that a person primarily uses is influenced by his or her age. In a randomly drawn sample, 369 social network users were asked which site they primarily visited. At the 0.05 level of significance, can we conclude that the two variables are related? These data are presented in the following table along with each person’s age group: Age (Years) Facebook Twitter LinkedIn 10-17 7 22 0 18-34 44 54 25 35-54 40 38 44 55 and older 26 38 31 a. What test should you run? b. Select the correct hypothesis statements. H0: H1: c. Compute the value of the test statistic? (Round your answer to 2 decimal places. Negative values should have a minus sign in front of them) d. Determine the p-value (Round your final answer to 4 decimal places.) e. What is your decision regarding the null hypothesis? multiple choice Fail to reject the null. Reject the…Birthweight In 2003 the Journal of the AmericanMedical Association reported a study examining thepossible impact of air pollution caused by the 9/11 attack New York’s World Trade Center on the weight ofbabies. Researchers found that 8% of 182 babies born tomothers who were exposed to heavy doses of soot andash on September 11 were classified as having low birthweight. Only 4% of 2300 babies born in another NewYork City hospital whose mothers had not been near thesite of the disaster were similarly classified. Does thisindicate a possibility that air pollution might be linked toa significantly higher proportion of low-weight babies?a) Was this an experiment? Explain. b) Test an appropriate hypothesis and state your conclu-sion in context. c) If you concluded there is a difference, estimate thatdifference with a confidence interval and interpret thatinterval in context.Weinstein, McDermott, And Roediger (2010) report that students who were given questions to be answered while studying new material had better scores when tested compared to students who were simply given an opportunity to re-read the material. In a similar study, an instructor in a large psychology class gave one group of students questions to be answered while studying for the final exam. The overall average for the exam was µ = 73.4 but the n = 16 students who answered questions had a mean of M = 78.3, with a standard deviation of s = 8.4. For this study, did answering questions while studying produce significantly higher exam scores? Use a one-tailed test with α = .05. What is the critical value for a one-tailed test at α = .05
- Weinstein, McDermott, and Roediger (2010) report that students who were given questions to be answered while studying new material had better scores when tested on the material compared to students who were simply given an opportunity to reread the material. In a similar study, an instructor in a large psychology class gave one group of students questions to be answered while studying for the final exam. The overall average for the exam was μ = 73.4, but the n = 16 students who answered questions had a mean of M = 78.3 with a standard deviation of s = 8.4. For this study, did answering questions while studying produce significantly higher exam scores? Use a one-tailed test with α = .01 and the Distributions tool to help. (Round your answers to three decimal places, when needed.) sMM = t-critical = t = The results indicate: Failure to reject the null hypothesis; answering questions while studying did not produce significantly higher exam scores…Weinstein, McDermott, and Roediger (2010) report that students who were given questions to be answered while studying new material had better scores when tested on the material compared to students who were simply given an opportunity to reread the material. In a similar study, an instructor in a large psychology class gave one group of students questions to be answered while studying for the final exam. The overall average for the exam was μ = 73.4, but the n = 16 students who answered questions had a mean of M = 78.3 with a standard deviation of s = 8.4. For this study, did answering questions while studying produce significantly higher exam scores? Use a one-tailed test with α = .01Suppose that in a study of 35 million HPV shots examined, the shots were followed in time by 14,000 serious ailments and 32 confirmed deaths. However, suppose in examining a randomly selected control group of 35 million non-vaccinated people of the same age at a particular time A, 0.0413% developed a serious ailment soon after time A, and 0.000089% died soon after time A. What does the comparison of two groups tell us? What are the percentages in the vaccinated group (serious ailments and confirmed deaths), and how to they compare to the nonvaccinated group? Hint: compute the percentages for serious ailments (14,000/35,000,000) and confirmed deaths (32/35,000,000) for the vaccinated group. Compare with the control group. Notice % above. (0,0413% and 0.000089%) Answer here. What can we conclude with high probability, if this comparison between vaccinated and non-vaccinated groups was done many times with the same basic results? Answer here. Can we absolutely rule out that the…