
MATLAB: An Introduction with Applications
6th Edition
ISBN: 9781119256830
Author: Amos Gilat
Publisher: John Wiley & Sons Inc
expand_more
expand_more
format_list_bulleted
Related questions
Question
thumb_up100%
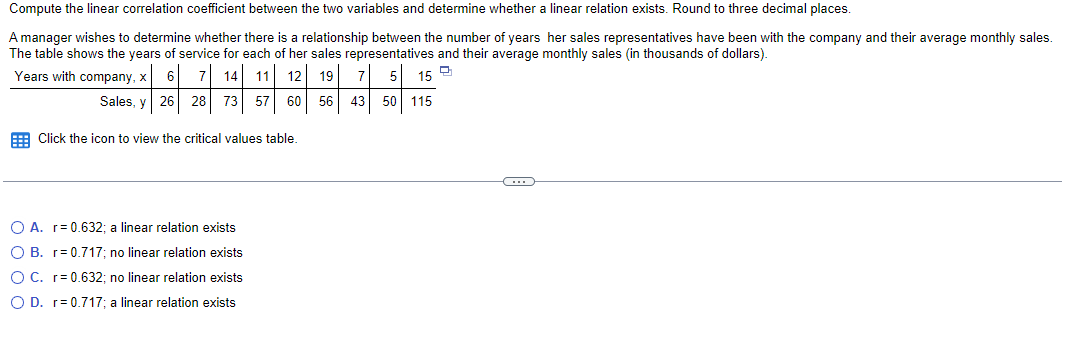

Transcribed Image Text:Compute the linear correlation coefficient between the two variables and determine whether a linear relation exists. Round to three decimal places.
A manager wishes to determine whether there is a relationship between the number of years her sales representatives have been with the company and their average monthly sales.
The table shows the years of service for each of her sales representatives and their average monthly sales (in thousands of dollars).
Years with company, x 6
7 14 11 12 19
7 5 15
Sales, y 26
28 73 57 60 56
43 50 115
Click the icon to view the critical values table.
O A. r=0.632; a linear relation exists
O B. r=0.717; no linear relation exists
O C.
r=0.632; no linear relation exists
O D. r=0.717; a linear relation exists
Expert Solution
This question has been solved!
Explore an expertly crafted, step-by-step solution for a thorough understanding of key concepts.

This is a popular solution

Trending nowThis is a popular solution!

Step by stepSolved in 3 steps with 1 images

Knowledge Booster

Similar questions
- The table below shows the amount of shrimp and the amount of beef bought by each of 7 people. Create a scatter plot for the data. Amount of shrimp (in pounds) 5 8 9 10 11 13 14 Amount of beef (in pounds) Amount of beef (in pounds) 11 1 4 10 2 9 8 12+ 10+ 8- 6- y 10 12 Amount of shrimp (in pounds) FO X - Sarrow_forwardPart c?arrow_forwardC. Describe the four characteristics of associationarrow_forward
- Desmos | Graphing Calc Year Time (seconds) 1912 82.2 1924 72.4 1932 66.8 1952 66.8 1960 61.2 1968 60.0 1976 55.65 1984 55.92 1992 54.64 2000 53.8 2008 53.1 a. Decide which variable should be the independent variable and which should be the dependent variable. b. Draw a scatter plot of the data. C. Does it appear from inspection that there is a relationship between the variables? Why or why not? d. Find the equation in the form of: y= a + bx. e. Find the correlation coefficient. f. Find the estimated gold medal time for 1932. Find the estimated time for 1984. g. Why are the answers from part f different from the chart values? h. Does it appear that a line is the best way to fit the data? Why or why not? i. Use the least-squares line to estimate the gold medal time for the next Summer Olympics (Assuming they would be in 2020). Do you think that your answer is reasonable? Why or why not? Note that the fastest speed time in recorded history as of 2020 was 51.22 seconds for the 100 meter…arrow_forwardThe chart shows the relationship between the amount of time, in days, and the percent of pollution in a pond. Day Percent Pollution 1 2 0 0 0 0 ASAWN 17 39.4 22.5 20 3 4 5 6 7 Based on the line of best fit, what should the percent of pollution in the pond be on day 14? 58 56 55 51 47 45 42arrow_forwardThe table gives information about the number of people staying in a hotel each quarter in 2020 and in 2021.Calculate the 4-point moving averages for this information. year 2020 2021 quarter 1 2 3 4 1 2 3 4 people 261 353 372 290 193 309 292 202arrow_forward
- Credit Score An economist wants to determine the relation between one’s FICO score, x, and the interest rate of a 36-month auto loan, y. The given data represent the interest rate ( in percent) a bank would offer on a 36-month auto loan for various FICOscores. Credit Score, x Interest Rate(percent),y 545 18.982 595 17.967 640 12.218 675 8.612 705 6.680 750 5.150 a. Find the least-squares regression line (Equation)treating the FICO score, x, as the explanatory variable and the interest rate , y, as the response variable. b. Determine the linear correlation coefficientbetween compensation and stock return. c. What type of linear relation exist between the two variable? d. Compute the coefficient of determination. e. Interpret the coefficient of determination. f. Draw a Scatter diagram of the data.arrow_forwardOption C is incorrectarrow_forwardThe scatter plot shows the relationship between the number of minutes studying for a test (x) and the Score earned (y). Make a scatterplot for the data. Time Studying (x) 40 50 60 70 80 90 100 110 Score (y) 2 3 6 7 9. +H+ 10 6. -7- 4 3 1- 10, 10 20 30 40 50 60 70 80 90 100 110 12 7:04 PM Desktop 12/8/2026arrow_forward
- Please answer FULL questionarrow_forwardA researcher explored the relationship between the percent of snow days during the month of January and the percent of students that receive an A on class finals at the same schools. The researcher collects information from 6 schools, shown in the table below. Use the graph below to plot the points and develop a linear relationship between the percent of January snow days and the percent of 'A' final exams. School Number % of Snow Days % of A Finals 1 5 25 2 7 45 3 10 50 4 12 65 5 20 70 6 25 86 Using the linear relationship graphed above, estimate the percent of 'A' finals if there are 2% snow days. Provide your answer below:arrow_forward
arrow_back_ios
arrow_forward_ios
Recommended textbooks for you
- MATLAB: An Introduction with ApplicationsStatisticsISBN:9781119256830Author:Amos GilatPublisher:John Wiley & Sons Inc
 Probability and Statistics for Engineering and th...StatisticsISBN:9781305251809Author:Jay L. DevorePublisher:Cengage Learning
 Statistics for The Behavioral Sciences (MindTap C...StatisticsISBN:9781305504912Author:Frederick J Gravetter, Larry B. WallnauPublisher:Cengage Learning
  Elementary Statistics: Picturing the World (7th E...StatisticsISBN:9780134683416Author:Ron Larson, Betsy FarberPublisher:PEARSON
 The Basic Practice of StatisticsStatisticsISBN:9781319042578Author:David S. Moore, William I. Notz, Michael A. FlignerPublisher:W. H. Freeman
 Introduction to the Practice of StatisticsStatisticsISBN:9781319013387Author:David S. Moore, George P. McCabe, Bruce A. CraigPublisher:W. H. Freeman
MATLAB: An Introduction with Applications
Statistics
ISBN:9781119256830
Author:Amos Gilat
Publisher:John Wiley & Sons Inc
Probability and Statistics for Engineering and th...
Statistics
ISBN:9781305251809
Author:Jay L. Devore
Publisher:Cengage Learning
Statistics for The Behavioral Sciences (MindTap C...
Statistics
ISBN:9781305504912
Author:Frederick J Gravetter, Larry B. Wallnau
Publisher:Cengage Learning
Elementary Statistics: Picturing the World (7th E...
Statistics
ISBN:9780134683416
Author:Ron Larson, Betsy Farber
Publisher:PEARSON
The Basic Practice of Statistics
Statistics
ISBN:9781319042578
Author:David S. Moore, William I. Notz, Michael A. Fligner
Publisher:W. H. Freeman
Introduction to the Practice of Statistics
Statistics
ISBN:9781319013387
Author:David S. Moore, George P. McCabe, Bruce A. Craig
Publisher:W. H. Freeman