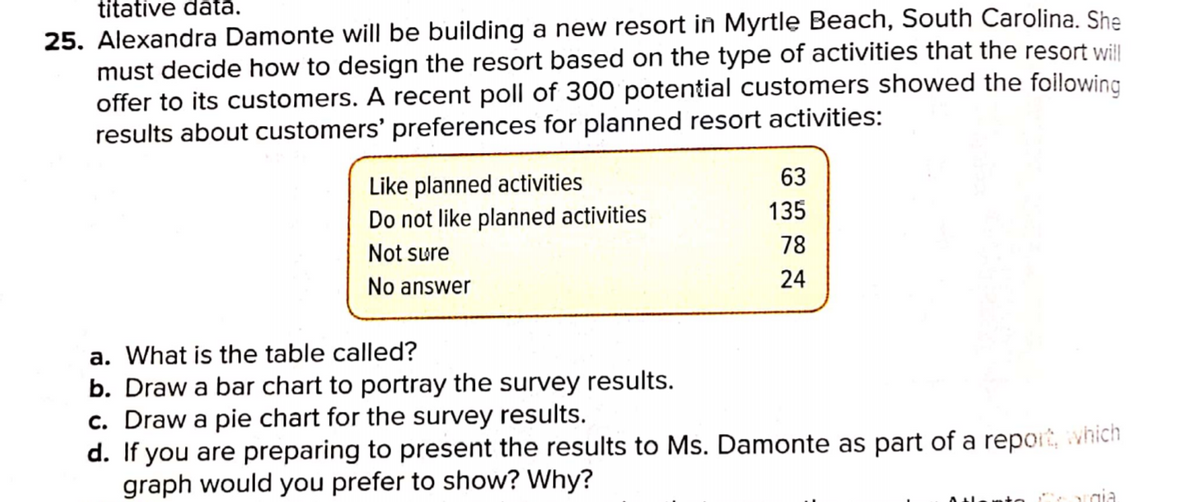
25. Alexandra Damonte will be building a new resort in Myrtle Beach, South Carolina. She must decide how to design the resort based on the type of activities that the resort will offer to its customers. A recent poll of 300 potential customers showed the foillowing results about customers' preferences for planned resort activities: 63 Like planned activities Do not like planned activities 135 Not sure 78 No answer 24 a. What is the table called? b. Draw a bar chart to portray the survey results. c. Draw a pie chart for the survey results. d. If you are preparing to present the results to Ms. Damonte as part of a repot, which graph would you prefer to show? Why?


Angles in Circles
Angles within a circle are feasible to create with the help of different properties of the circle such as radii, tangents, and chords. The radius is the distance from the center of the circle to the circumference of the circle. A tangent is a line made perpendicular to the radius through its endpoint placed on the circle as well as the line drawn at right angles to a tangent across the point of contact when the circle passes through the center of the circle. The chord is a line segment with its endpoints on the circle. A secant line or secant is the infinite extension of the chord.
Arcs in Circles
A circular arc is the arc of a circle formed by two distinct points. It is a section or segment of the circumference of a circle. A straight line passing through the center connecting the two distinct ends of the arc is termed a semi-circular arc.
25


Trending now
This is a popular solution!

Step by step
Solved in 2 steps with 2 images


