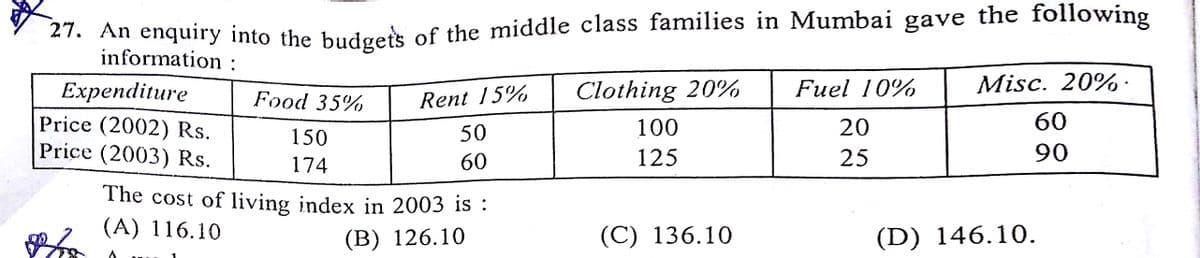
27. An enquiry into the budgers of the middle class families in Mumbai gave the following information : Fuel 10% Misc. 20%. Expenditure Price (2002) Rs. Price (2003) Rs. Food 35% Clothing 20% Rent 15% 100 20 60 150 50 60 125 25 90 174 The cost of living index in 2003 is : (A) 116.10 (B) 126.10 (С) 136,10 (D) 146.10.


Q: In a class of 50 students, 10 have failed and their average of marks is 2 5. The total narks secured...
A: Given: total 50 students 10 failed students average of failed students is 2.5 total marks 281
Q: A Wall Street firm is trying to package nine mortgages for sale. The sizes of the mortgages (in thou...
A: Given Information: Mortgage Amount 1 910 2 870 3 810 4 640 5 550 6 250 7 120 8 95...
Q: Question: The following contingency table shows the number of customers who bought various brands of...
A: Required probability is P(FujiFilm | Best Buy)
Q: A certain tennis player makes a successful serve 70% of the time. Assume that each serve is independ...
A:
Q: Of the 6 explanatory variables below, how many are not significant at the 1% level? Observations 133...
A: Result: P value< level of significance then variable is significant. P value> level of signif...
Q: 6) A test designed for fifth graders is given to eighth graders. Explain your reasoning or provide a...
A: Given that, a test designed for fifth graders is given to eighth graders.
Q: The table below displays the (mean) maximum July temperature measured over ten years at the Armagh w...
A: In this question given that the table of maximum temperature of july in different year Find Mean,Med...
Q: An analog source is sampled and the samples xn are obtained. The samples have a dynamic range [-xmax...
A:
Q: Incidence rate refers to new cases for 'collective time at-risk' that can be measured as person-year...
A: Given information: It is given that the, 3-year study reported a total of 3538 cases at the end of t...
Q: A certain tennis player makes a successful serve 70% of the time. Assume that each serve is independ...
A: Givenp=0.70n=6x~Binomial(n=6,p=0.70)P(X=x)=(nx)×px×(1-p)n-x ; x=0,1,...,n
Q: I Suppose X is a random variable for which E(X)=1 and V(X)=25. Find the values of a and b , such tha...
A:
Q: X Y 4 0.10 0.15 3 0.20 0.30 0.10 0.15 2. 1.
A:
Q: A pair of dice is rolled and the sum is determined. Let the random variable X denote this sum. What ...
A:
Q: Below are the ages at which U.S. presidents began their first terms, increasing in order from George...
A: The mean for the dataset is calculated by dividing the sum of all data points, with the number of da...
Q: In a family with 10 children the p = probability of a boy = 0.5. Find the binomial exact probability...
A: Givensample size(n)=10probability of a boy(p)=0.5x≅Binomial(n=10,p=0.5)P(X=x)=(nx)×px×(1-p)x ; x=...
Q: What does this information tell you about the variability of the student's performance on the prelim...
A: Given The data is as follows:
Q: The density function of a certain random variable X is given by 1 B(a, e)*(1 – x)o-1 0, f(x) ,if 0 <...
A:
Q: COVID is known to affect one in ten thousand people. A screening test for the virus shows a positive...
A: The given data is , COVID is known to affect one in ten thousand people. i.e. probability of COVID ...
Q: The quantities below are calculated from a sample of data set Determine the lease square regression ...
A: We have given that data Regression equation. Y^ = a + bx
Q: Four coins are tossed simultaneously. What is the probability of geting (i) 2 heads and 2 tails (ii)...
A:
Q: Find the indicated area under the curve of the standard normal distribution; then convert it to a p...
A: Given that ; Find the indicated area under the curve of the standard normal distribution; then con...
Q: What is the CIV of each of the customers? Amber Jung Joe Ashley Lauren Maria Jose Customer Amber Ash...
A:
Q: Let z be a random variable with a standard normal distribution. Find the indicated probability. (Rou...
A: Note: This probability value calculated from standard normal distribution table
Q: (X1, X2,..., Xn) are independent and identically distributed random variables with density function ...
A:
Q: We are interested in estimating the proportion of graduates at a mid-sized university who found a jo...
A: From the provided information, 340 out of 430 graduates found jobs within one year. Sample size (n) ...
Q: (a) Determine the mean and the standard deviation for each data set.
A:
Q: A store in donated a lot of 8 computer sets that includes 3 which are malfunctioning or defective. I...
A: Given : No. of computer (N) = 8 Let Y : No. of defective or malfunctioning computer sets Here Y = ...
Q: Test each of the following by performing the steps in hypothesis testing. The time coding an algori...
A:
Q: For the following data, what is SSbetween treatments? Treatments Subject I II ...
A: The formula of SS due to treatments is,
Q: lustration 9.31. Twenty per cent of the workers in a firm em- ploying a total of 2,000 earn less tha...
A:
Q: Find a suitable coefficient of correlation for the following data : Fertilizer used (metric tons) Pr...
A:
Q: Assume that a sample is used to estimate a population proportion p. Find the 99.5% confidence interv...
A: Here, x =230 The sample size n = 324. The absolute value of Zα/2 is 2.8070 using the Excel formula “...
Q: Consider the three groups of four students, where each group is subjected to one of the three strate...
A: There are three groups of four students. The each group is subjected to the method of teaching and s...
Q: Calculate mean deviation from median from the following data : Marks less than No. of Students 80 70...
A:
Q: Show two (one of the first three and one from the bottom three) of the following properties on Stoch...
A: To show that:
Q: holders is as follows : Number Age as on nearest birthday 17-19-5 20-25-5 26-35-5 36-40-5 41-50-5 51...
A: Given data is Age as on nearest birthday number 17 - 19.5 9 20 - 25.5 16 26 - 35.5 12 36 ...
Q: From 5 statisticians and 6 economists, a committee of size 6 is to be formed. How many different com...
A:
Q: Write the research hypothesis Write your final conclusions
A: Here Given Sample size=n=120 No of faculty approve candidate x=65 p^ = 65120 = 0.541666 = 0.542 α=0....
Q: DISCUSSION 3 Discuss why correlations does not necessarily means causality. After performing some re...
A: Correlation Correlation is a statistical measure that expresses the extent to which two variabl...
Q: In the construction of a certain cost of living Index Number the following group index numbers were ...
A:
Q: In a class of 50 students, 10 have failed and their average of marks is 2 5. The total niarks secure...
A:
Q: We wish to estimate what percent of adult residents in a certain county are parents. Out of 100 adul...
A:
Q: About locating percentile under the normal curve. Direction: Solve the following.
A: The z score is used to determine the number of deviation from the mean. It is calculated by the comb...
Q: The following series gives the height of trees in a garden. From these data, calculate the Karl Pear...
A:
Q: 1. Full-time Ph.D. students receive an average of P12837 per year. If the average salaries are norma...
A:
Q: 4.8 Suppose that Y has density function ( ky(1 – y), 0< y <1, f(y) = lo, elsewhere. a Find the value...
A:
Q: Part 1 a. What is the probability that the sample percentage indicating that lack of ethical culture...
A: As per the Bartleby guildlines we have to solve first three subparts and rest can be reposted... G...
Q: A box containing 8 yellow and 5 red marbles. If two marbles are to be drawn at random without replac...
A: If the probability of getting selected for each outcome is equal then such outcomes can be termed as...
Q: Find out the median of the following items : 10, 8,.5, 13, 4, 9, 7
A:
Q: Suppose that Jerry (a baker) wants to find a 95% Confidence Interval for the mean baking time for al...
A: We have given that, Sample mean (x̄) = 16.4, standard deviation (s) = 2.2 and sample size (n) = 40 ...

Step by step
Solved in 2 steps with 2 images

- 43. The U.S. government wants to determine whetherimmigrants should be tested for a contagious disease,and it is planning to base this decision on financialconsiderations. Assume that each immigrant who isallowed to enter the United States and has the diseasecosts the country $100,000. Also, assume that eachimmigrant who is allowed to enter the United Statesand does not have the disease will contribute $10,000to the national economy. Finally, assume that x percentof all potential immigrants have the disease. The U.S.government can choose to admit all immigrants, admitno immigrants, or test immigrants for the diseasebefore determining whether they should be admitted. Itcosts T dollars to test a person for the disease, and thetest result is either positive or negative. A person who does not have the disease always tests negative. However, 10% of all people who do have the disease testnegative. The government’s goal is to maximize theexpected net financial benefits per potential…2. A leading researcher in the study of interstate highway accidents proposes that a major cause of many collisions on the interstates is not the speed of the vehicles but rather the difference in speeds of the vehicles. When some vehicles are traveling slowly while other vehicles are traveling at speeds greatly in excess of the speed limit, the faster-moving vehicles may have to change lanes quickly, which can increase the chance of an accident. Thus, when there is a large variation in the speeds of the vehicles in a given location on the interstate, there may be a larger number of accidents than when the traffic is moving at a more uniform speed. The researcher believes that when the standard deviation in speed of vehicles exceeds 10 mph, the rate of accidents is greatly increased. During a 1-hour period of time, a random sample of 50 vehicles is selected from a section of an interstate known to have a high rate of accidents, and their speeds are recorded using a radar gun. The data…2) . In February 2021, the Chicago Tribune reported:“The overdose epidemic that has ravaged Chicago has not spared the nearby suburbs, some of which have death rates comparable to anything seen in the city, according to a report released this week by the Cook County Department of Public Health. ZIP codes in the towns of Worth, Broadview, Maywood, and Forest Park, areas that “have substantially lower median household incomes and higher poverty rates,” have been especially hard-hit, the report said.”In the article, they claimed that lower incomes were associated with higher overdose death rates and that overdose death rates are increasing over time. The data you have been analyzing wasn’t focused on Chicago, obviously. But do your results support the general gist of the statistical argument being made in this Tribune excerpt? Please address:• Do overdose death rates appear to be associated with per capita income (use scatterplot)?• Do overdose death rates appear to be increasing over…
- 7.6 A leading researcher in the study of interstate highway accidents proposes that a major cause of many collisions on the interstates is not the speed of the vehicles but rather the difference in speeds of the vehicles. When some vehicles are traveling slowly while other vehicles are traveling at speeds greatly in excess of the speed limit, the faster-moving vehicles may have to change lanes quickly, which can increase the chance of an accident. Thus, when there is a large variation in the speeds of the vehicles in a given location on the interstate, there may be a larger number of accidents than when the traffic is moving at a more uniform speed. The researcher believes that when the standard deviation in speed of vehicles exceeds 10 mph, the rate of accidents is greatly increased. During a 1-hour period of time, a random sample of 50 vehicles is selected from a section of an interstate known to have a high rate of accidents, and their speeds are recorded using a radar gun. The data…Suppose that a healthy person has 10% chance of getting sick that would require $40,000 of medical expenses. Suppose that unhealthy person has a 60% chance of getting sick that would require $100,000 in medical expenses. A) What would be an actuarially fair premium for a healthy person? B) What would be an actuarially fair premium for unhealthy person? C) If everyone has to buy health insurance and 20% of the population are unhealthy and 80% of the population are health, what would be an actuarially fair premium for any person?There is some evidence that, in the years 1981-85, a simple name change resulted in a short-term increase in the price of certain business firms' stocks (relative to the prices of similar stocks). (See D. Horsky and P. Swyngedouw, "Does it pay to change your company's name? A stock market perspective," Marketing Science v.6, pp. 320-35,1987.) Suppose that, to test the profitability of name changes in the more recent market (the past five years), we analyze the stock prices of a large sample of corporations shortly after they changed names, and we find that the mean relative increase in stock price was about 0.87 %, with a standard deviation of 16 %. Suppose that this mean and standard deviation apply to the population of all companies that changed names during the past five years. Complete the following statements about the distribution of relative increases in stock price for all companies that changed names during the past five years. (a) According to Chebyshev's theorem, at least…
- There is some evidence that, in the years 1981— 85, a simple name change resulted in a short-term increase in the price of certain business firms' stocks (relative to the prices of similar stocks). (See D. Horsky and P. Swyngedouw, "Does it pay to change your company's name? A stock market perspective," Marketing Science v.6 pp. 320— 35, 1987.) Suppose that, to test the profitability of name changes in the more recent market (the past five years), we analyze the stock prices of a large sample of corporations shortly after they changed names, and we find that the mean relative increase in stock price was about 0.76%, with a standard deviation of 0.12%. Suppose that this mean and standard deviation apply to the population of all companies that changed names during the past five years. Complete the following statements about the distribution of relative increases in stock price for all companies that changed names during the past five years. (a)According to Chebyshev's theorem,…Suppose that 3000 drivers in Wakanda were randomly breath-tested on 21 April 2019 and 116 were above the limit of 0.05 blood- alcohol level. On 15 May 2019, 4000 drivers were tested and 98 were above this level. 1.3.1 What additional information would you require before trying to draw conclusion from these data? (5) 1.3.2 What factors, other than a real change in driver behaviours, could cause such a drop in the proportion of above-the-limit drivers. (6) 1.4 A set of data has an interquartile range of 20 and a lower quartile of 6. If the data is symmetrical, calculate the value of the median.An insurance company offers four different deductible levels—none, low, medium, and high—for its homeowner’s policyholders and three different levels—low, medium, and high—for its automobile policyholders. The accompanying table gives proportions for the various categories of policyholders who have both types of insurance. For example, theproportion of individuals with both low homeowner’s deductible and low auto deductible is .06 (6% of all such individuals).Suppose an individual having both types of policies is randomly selected.a. What is the probability that the individual has a medium auto deductible and a high homeowner’s deductible?b. What is the probability that the individual has a low auto deductible? A low homeowner’s deductible?c. What is the probability that the individual is in the same category for both auto and homeowner’s deductibles?d. Based on your answer in part (c), what is the probability that the two categories are different?e. What is the probability that the…
- 8A.If there is no seasonal effect on people getting sick, we would expect equal numbers of people getting sick in each season (winter, spring, summer and fall). A student takes a census of students who took Marketing Research in 2019 and finds that of the 280 students who took Marketing Research in 2019, 75 were sick in winter, 65 were sick in spring, 68 were sick in summer and 72 were sick in fall. She wonders if the excess in the winter is an indication that sickness rates are not uniform throughout the year. Perform the appropriate chi-square test and indicate the chi-square value below. (Report two decimals) QUESTION 8b Indicate whether the associated p-value for the chi-square value you calculated for question 8 is significant. Yes NoA school district started using a new criteria for selecting which students entered their "accelerated" math track, starting in 6th grade. The study found that under the new criteria about 75% of the students in the district were eligible for accelerated math in 6th grade, but that from one year to the next only about 2/3 of the students stayed in the accelerated track. a) Assuming that everyone who is eligible enrolls the first year, make a TABLE that shows the percent of the students in the district that would be expected to be enrolled in the accelerated track each year from 6th grade until 10th grade. Please show the work you used to fill in your table. b) Considering that from one year to the next about 2/3 of the students stay in the accelerated track, is there a grade level in which you'd expect about 1/10 as many students in the accelerated track as there were in 6th grade? Does the number of students in the accelerated track in 6th grade affect your answer? Please show your…1. Suppose that two students, A and B, are both 29 years old but A is a female whereas B is a male, A is single while B is married. Both had an income of 4500 cedis when in the university and both have health inventory score of 21. Student A had two kids while in the university whereas student B had 4 kids. Both scored 16 on life satisfaction inventories as well as 23 on socioeconomic status of parents. Student A was a smoker but B was not. A scored 7 while B scored 12 on spirituality inventory. Both finished the university program but whiles a was earning 9000 Ghana cedis seven years after university, B was earning 6800. What is the predicted difference in the life satisfaction score of these two student seven years after university? 2. How much higher is the life satisfaction score predicted to be if the score on spirituality inventory rises by 25? 3. Which one of the pairs of variables selected to be multicollinear may be deleted from the regression and why? 4. Interpret the…


