2a. right the hypothesis in symbolic form determine if the test is right tailed left tailed or two tails and explain why. 2b. calculate the critical value the test statistic and P value. show calculations below. explain your calculations and include your results Critical Value Test Statistic P-value 2c. make a decision about the null hypothesis using both the critical value and P value methods. explain how you arrived at your results. 2d. restate your conclusion in non-technical terms.
2a. right the hypothesis in symbolic form determine if the test is right tailed left tailed or two tails and explain why. 2b. calculate the critical value the test statistic and P value. show calculations below. explain your calculations and include your results Critical Value Test Statistic P-value 2c. make a decision about the null hypothesis using both the critical value and P value methods. explain how you arrived at your results. 2d. restate your conclusion in non-technical terms.

Linear Algebra: A Modern Introduction
4th Edition
ISBN:9781285463247
Author:David Poole
Publisher:David Poole
Chapter4: Eigenvalues And Eigenvectors
Section4.6: Applications And The Perron-frobenius Theorem
Problem 22EQ

Related questions
Question
2a. right the hypothesis in symbolic form determine if the test is right tailed left tailed or two tails and explain why.
2b. calculate the critical value the test statistic and P value. show calculations below. explain your calculations and include your results
Critical Value
Test Statistic
P-value
2c. make a decision about the null hypothesis using both the critical value and P value methods. explain how you arrived at your results.
2d. restate your conclusion in non-technical terms.
Transcribed Image Text:LE Copy
U
Clipboard
1
12
13
14
15
16
Format Painter
A
18
19
20
21
22
23
24
25
26
27
28
29
B
Ready
BIU
C
fx
X1
$1
D
Men Spending
n1
Font
V
Type here to search
M
E
E
Formulas
Y
A
Α Α΄
TE
F
A-
Data
G
Women Spending
n₂
X₂
$2
I
A+
Review
O At
ab
2h Calculate the critical value the test statistic and n-value Show calculations below
Question 2 Question 3
Question 1
+
Accessibility: Investigate
X
W
H
Alignment
7
ab Wrap Text
He
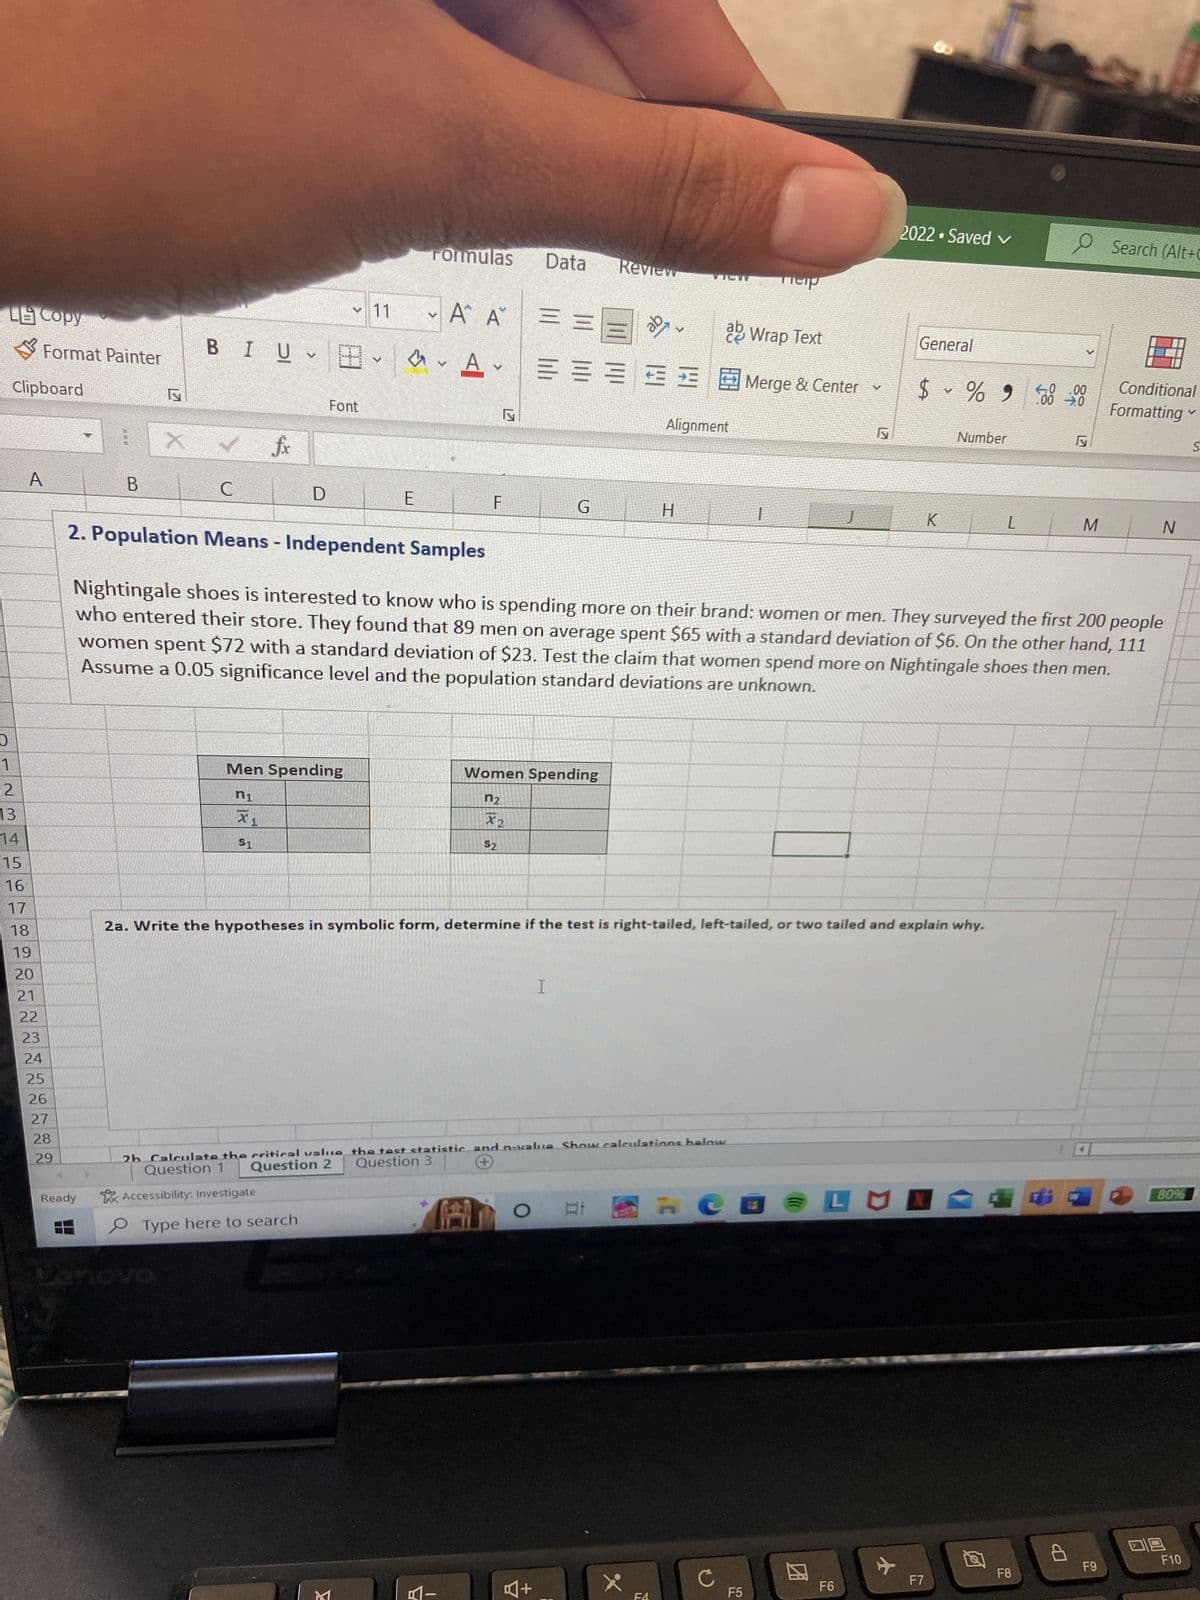
2a. Write the hypotheses in symbolic form, determine if the test is right-tailed, left-tailed, or two tailed and explain why.
с
Teip
Merge & Center
T
2. Population Means - Independent Samples
Nightingale shoes is interested to know who is spending more on their brand: women or men. They surveyed the first 200 people
who entered their store. They found that 89 men on average spent $65 with a standard deviation of $6. On the other hand, 111
women spent $72 with a standard deviation of $23. Test the claim that women spend more on Nightingale shoes then men.
Assume a 0.05 significance level and the population standard deviations are unknown.
F5
V
21
2022 Saved ✓
F6
General
%
$ ~ % 9
K
LUN
Number
F7
L
F8
e
40.00
.00 ➜.0
P
M
Search (Alt+C
F9
Conditional
Formatting ✓
S
N
80%
09
F10
Expert Solution
This question has been solved!
Explore an expertly crafted, step-by-step solution for a thorough understanding of key concepts.

Step by step
Solved in 2 steps

Recommended textbooks for you
Linear Algebra: A Modern Introduction
Algebra
ISBN:
9781285463247
Author:
David Poole
Publisher:
Cengage Learning

Functions and Change: A Modeling Approach to Coll…
Algebra
ISBN:
9781337111348
Author:
Bruce Crauder, Benny Evans, Alan Noell
Publisher:
Cengage Learning
Linear Algebra: A Modern Introduction
Algebra
ISBN:
9781285463247
Author:
David Poole
Publisher:
Cengage Learning
Functions and Change: A Modeling Approach to Coll…
Algebra
ISBN:
9781337111348
Author:
Bruce Crauder, Benny Evans, Alan Noell
Publisher:
Cengage Learning