2.3 Compute the Mean deviation from mean and Mean deviation from mode for the following frequency distribution. Weights 118-126 127-135 136-144 145-153 154-162 No. of Students 3 5 25 12 5 A lso find the coefficient of mean deviation from mean
2.3 Compute the Mean deviation from mean and Mean deviation from mode for the following frequency distribution. Weights 118-126 127-135 136-144 145-153 154-162 No. of Students 3 5 25 12 5 A lso find the coefficient of mean deviation from mean

Glencoe Algebra 1, Student Edition, 9780079039897, 0079039898, 2018
18th Edition
ISBN:9780079039897
Author:Carter
Publisher:Carter
Chapter10: Statistics
Section10.5: Comparing Sets Of Data
Problem 14PPS

Related questions
Question
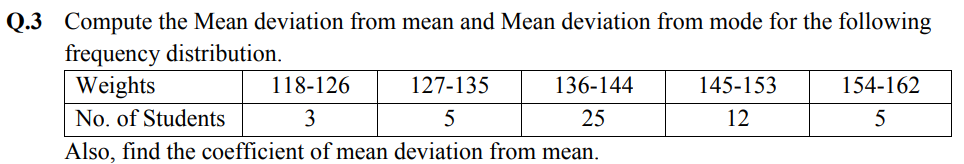
Transcribed Image Text:Q.3 Compute the Mean deviation from mean and Mean deviation from mode for the following
frequency distribution.
Weights
118-126
127-135
136-144
145-153
154-162
No. of Students
3
25
12
5
Also, find the coefficient of mean deviation from mean.
Expert Solution
This question has been solved!
Explore an expertly crafted, step-by-step solution for a thorough understanding of key concepts.

Step by step
Solved in 2 steps

Recommended textbooks for you
Glencoe Algebra 1, Student Edition, 9780079039897…
Algebra
ISBN:
9780079039897
Author:
Carter
Publisher:
McGraw Hill
Glencoe Algebra 1, Student Edition, 9780079039897…
Algebra
ISBN:
9780079039897
Author:
Carter
Publisher:
McGraw Hill