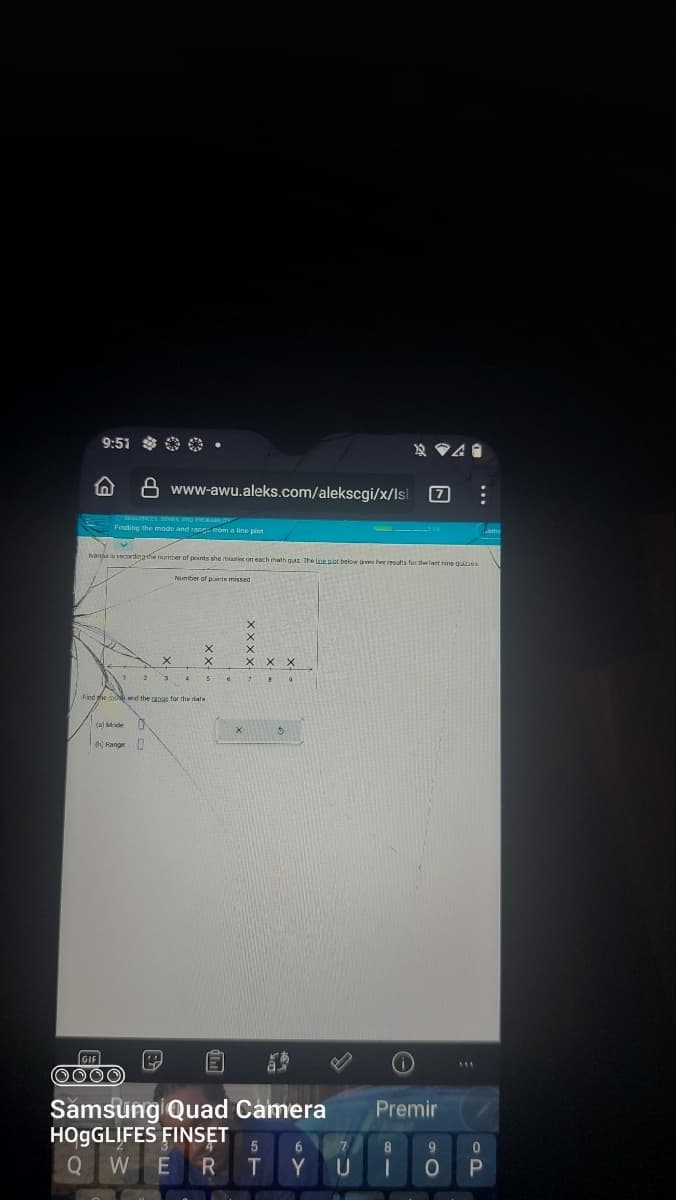
3 Finding the mode and rane trom a line plot www-awu.aleks.com/alekscgi/x/lsl. Ivana is recording the number of points she misses on each math quiz. The inegot below gives he results for the last nine quizzes Number of punte missed (4) Mode Range: D X Find he wed the canas for the data X X X X XXX S Am


Q: The next three problems are based on the following scenario. A small country with three states (A,…
A: Given data is as follows: State Population A 733 B 351 C 416 Total 1500 Number of…
Q: Find the percentage of data that lies below -2.40, above 1.73, and between -2.40 and 1.73
A: Given data To Find the percentage of data that lies below -2.40, above 1.73, and between -2.40 and…
Q: The year Ryan graduated college, he got a job as an entry-level software engineer working for a firm…
A: Given,mean(μ)=$70,000Standard deviation(σ)=$5300Ryan's starting salary(X)=$72,000
Q: The tourist bureau of the Hawaiian Islands surveyed a sample of 6 United States tourists as they…
A: Given data set is 6,7,11,12,9,9sample size(n)=6
Q: Fifteen items or less: The number of customers in line at a supermarket express checkout counter is…
A: X p(x) 0 0.05 1 0.25 2 0.30 3 0.20 4 0.10 5 0.10
Q: Suppose a study reported that the average person watched 3.46 hours of television per day. A random…
A:
Q: A psychologist is studying the self image of smokers, which she measures by the self-image (SI)…
A: Givenstandard deviation(σ)=82confidence level=95%Margin of error(E)=15
Q: You measure 43 backpacks' weights, and find they have a mean weight of 69 ounces. Assume the…
A: Given that Sample size n =43 Sample mean =69 Population standard deviation =7.6
Q: 3. The following data are the heights in centimeters of 200 female students in a certain college.…
A: Given information: Length Frequency 150 < X < 155 21 155 < X < 160 44 160 <…
Q: In a random sample of 375 students at a university, 315 stated that they were nonsmokers. Based on…
A: Given that Sample size n =375 Favorable cases x =315 Sample proportion p^=x/n =315/375 =0.84
Q: CHOOSE THE LETTER OF THE CORRECT ANSWER (PLEASE ANSWER EVERYTHING AND NO NEED FOR AN EXPLANATION)…
A: Note: As per guidelines we will only answer the first three subparts, please repost other subparts…
Q: G class x Trave X Cert X Cop, x Inferential data Orec X New x 2 eban X…
A: We have given the following information. Continuous data set: The data set that takes any numerical…
Q: Big babies: The National Health Statistics Reports described a study in which a sample of 330…
A: We have given thatSample size (n) = 330Sample mean (x̅) = 25.4Standard deviations (s) =…
Q: A factorial experiment was designed to test for any significant differences in the time needed to…
A:
Q: You would like to construct a 99% confidence interval to estimate today's population mean…
A: Solution: Given information: x= 58.5 Sample mean s= 3.0 Sample standard deviation
Q: For a one-tailed hypothesis test the critical value is 2.485. What is your statistical decision if t…
A: We have given, For a one-tailed hypothesis test the critical value is 2.485 And the test statistic…
Q: Students at Roseville High School took an IQ test with a mean of 100 and a standard deviation of 15.…
A: GivenMean(μ)=100standard deviation(σ)=15
Q: Suppose that the index model for stocks A and B is estimated from excess returns with the following…
A: Please find the explanation below. Thank you
Q: A company that makes cola drinks states that the mean caffeine content per 12-ounce bottle of cola…
A: Givensample size(n)=30Mean(x)=42.5standard deviation(σ)=6.3α=0.05
Q: 11. Preventing heart attacks: Medical researchers performed a comparison of two drugs, clopidogrel…
A:
Q: s the following distribution sh
A: Skewness: A frequency distribution of the set of values that is not symmetrical is called…
Q: College bound: A national college researcher reported that 68% of students who graduated from high…
A: From the provided information, 68% of students who graduated from high school in 2012 enrolled in…
Q: An old medical textbook states that the mean sodium level for healthy adults is 138mEq per liter of…
A: Given that Sample size n =60 Sample mean =142 Population standard deviation =13
Q: The data show the number of hours spent studying per day by a sample of 28 students. Use the…
A: Given data: x 1 11 8 4 6 9 6 5 0 6 8 3 2 6 7 1 9 4 0 9…
Q: uestion 3
A: Given: 96 99 90 56 71 94 86 71 64 91 84 68 88 73 81 73 65 57…
Q: Suppose that a certain college class contains 59 students. Of these, 27 are sophomores, 34 are…
A: Given that N = 59n(S) = Number of Sophomores majors = 27n(M) = Number of Mathematics majors = 34n(…
Q: Within the class, my classmates and I are given a fixed daily allowance by our parents. Curious, I…
A: Solution: Let X be the daily allowance. The data for X is 20, 50, 150, 50, 50, 50, 70, 50, 100, 30,…
Q: Brand A D C --0 P G H 1 3 10. 0140 H₂A₁D data on Weight H₂O ONA 20 H₂ P₁ <0 H₁₁0 16.1 14.9 15.9…
A: Solution: Given information: n= 10 observation k= 1 independent variable SSE= 6833947.38 Sum of…
Q: A mayor running for re-election claims that during his term, average municipal taxes have fallen by…
A: Given information: 121, 139, 121, 125, 118, 145, 141, 91, 127, 136, 144, 154, 131, 139, 125, 108,…
Q: A random va a. Calculate the following probabilities below for the distribution. 1. P(x ≤20) 2.…
A: Solution
Q: Section 7.1 7.1 7.2 Population vs. Sample (Example 10) In 2017 the Gallup poll surveyed 1021 adults…
A: The whole class we would like to establish assessments about is referred to as a population. The…
Q: Determine which numbers could be used to represent the probability of an event. Select all that…
A:
Q: The table shows the total square footage (in billions) of retailing space at shopping centers and…
A:
Q: A variable x is normally distributed with mean 20 and standard deviation 8. Round your answers to…
A: GivenMean(μ)=20standard deviation(σ)=8
Q: Cound to three decimal places as needed.) o the data provide sufficient evidence to conclude that…
A:
Q: 3) Suppose that X₁, X₂, ..., X₁00 is a random sample from a normally distributed population with…
A: Since you have posted a question with multiple sub-parts, we will solve first three subparts for…
Q: The following is a set of data from a sample of n = 7 6 13 5 2 7 16 18 (a) Compute the first…
A:
Q: A certain type of candy is reported to be distributed with the color percentages shown in the table…
A: Given data is as follows: Color Percentage,p Observed Frequency,O Green 0.15 20 Orange 0.21…
Q: The Acme Company manufactures widgets. The distribution of widget weights is bell-shaped. The widget…
A: Given Mean=45 Standard deviations=7
Q: Out of 400 people sampled, 260 preferred Candidate A. Based on this estimate, what proportion (as a…
A: Given info: Out of 400 people sampled, 260 preferred Candidate A. Based on this estimate, the…
Q: Find the indicated area under the curve of the standard normal distribution, then convert it to a…
A: The z-scores are -1 and 1.
Q: In a 2012 survey, Gallup asked a random sample of U.S. adults if they would prefer to have a job…
A:
Q: In a town, a resident must choose: an internet provider, a TV provider, and a cell phone service…
A: Sample is the subset of population. It has comparatively small size than population. Sample space…
Q: Review Chapters 7 & 8 6) Divide the data into two groups: those with High School GPA under 3.5 and…
A: Given information: High school College GPA 3.85 3.68 3.22 3.1 2.99 2.72 3.89 3.61 4.1 4…
Q: The following histogram shows the exam scores for a free algebra class. Use this histagram to answer…
A: class frequency 70.5-75.5 15 75.5-80.5 16 80.5-85.5 14 85.5-90.5 11 90.5-95.5 4…
Q: 5. Suppose 7% of all households have no home telephone but depend completely on cell phones. Find…
A: 5)Givenp=0.07n=450x~Binomial(n=450,p=0.07)P(X=x)=(nx)(p)x(1-p)n-x ; x=0,1,..,n
Q: Suppose that a box contains 8 cameras and that 5 of them are defective. A sample of 2 cameras is…
A: Given P=5/8=0.625 n=2
Q: Determine the null hypothesis, alternative hypothesis, student's t calculation, critical region (see…
A: n1 = 21 n2 = 21 Formula Used: Formula Used: Test-statistic t = X1 - X2s12n1+s22n2
Q: A random variable follows the continuous uniform distribution between 20 and 120. a. Calculate the…
A:
Q: liminary data analyses indicate that you can reasonably consider the assumptions for ng pooled…
A: Given: x¯1=13.10s1=3.90n1=n2=10x¯2=17.310s2=3.68 Level of confidence = 0.98

Step by step
Solved in 2 steps

- You source a battery for your product from two different suppliers (A and B). You suspect that theequivalent series resistance (ESR) of batteries supplied by the two suppliers is not the same. Thestandard deviation of ESR from each supplier is 2 ohms. You would like to be able to determine an ESRdifference of 1 ohms between suppliers. How many parts would you need to sample from each supplier(assume you sample the same number from each supplier) for a power level of 90%. Assume the desiredsignificance level (?) is 5%.Assume that the readings on the thermometers are normally distributed with the mean of 0° and standard deviation of 1.00°C. Assume 2.5% of the thermometers are rejected because they have readings that are too high and another 2.5% are rejected because they have readings that are too low. Draw a sketch and find the two readings that are cutoff values separating the rejected thermometers from the others. Which graphs represent the region in which thermometers are rejected? The cutoff values are ______ degrees. (Use a comma to separate answers as needed. Round to two decimal places as needed)Find kurtosis by using ungroup data given in the picture using quartile deviation, make sure to arrange data before solving question.
- Having the variation data regression line r=0.931 and the calculated coefficient of determination of 0.867.. And explained variation of the data of 86.7%.. About the unexplained variation? [ ] % of the variation is unexplained and is due to other factors or to sampling error. (Round to one decimal place as needed.)The pulse rates of 161 randomly selected adult males vary from a low of 37 bpm to a high of 97 bpm. Find the minimum sample size required to estimate the mean pulse rate of adult males. Assume that we want 95% confidence that the sample mean is within 4 bpm of the population mean. Complete parts (a) through (c) below. a. Find the sample size using the range rule of thumb to estimate σ.Assume that σ=13.7 bpm, based on the value s=13.7 bpm from the sample of 161 male pulse rates. c. Compare the results from parts (a) and (b). Which result is likely to be better?To compare the effectiveness of competing fertilizers on increasing radish size, researchers randomly divided 20 radish seeds of the same type into two groups of 10 and planted them. To one of the groups they applied Fertilizer A, and to the other, they applied Fertilizer B. Then they measured the radii of the radishes grown from the seeds in the two groups. The results of the experiment are shown in the tables. The mean radius for the group that was given Fertilizer A is (less,greater)than that for the group that was given Fertilizer B. The variability of the radii for the group that was given Fertilizer A is (less/greater)than that for the group that was given Fertilizer B. The data for both of the groups produces a (uniform, non-uniform) distribution.
- A pharmcuticle company claims that its new drug reduces systolic blood pressure. The systolic blood pressure (in millimeters of Mercury) for 9 patients before taking the new drug and 2 hours after taking the drug are shown in the table below. is there enough evidence support the company's claim? Let D =(blood pressure before taking new drug)- (blood pressure after taking new drug).use significant levels of a=their 0.05 for the test. Assume that the systolic blood pressure levels are normally distributed for the population of patience both Before & After taking the new drug. 1.State the null and alternative hypothesis for the test. 2. Find the value of the standard deviation of the paired differences. Round to one decimal place. 3.compute the value of the test statistic. Round to three decimal places 4.determine the decision rule for rejecting the null hypothesis Ho. Round the numerical portion to three decimals. 5.make decision for the hypothesis test.The pulse rates of 174 randomly selected adult males vary from a low of 45 bpm to a high of 105 bpm. Find the minimum sample size required to estimate the mean pulse rate of adult males. Assume that we want 90% confidence that the sample mean is within 2 bpm of the population mean. Complete parts (a) through (c) below. Assume that σ=10.8 bpm, based on the value s=10.8 bpm from the sample of 174 male pulse rates.d. Denote the expected return and its standard deviation as functions of π byμ(π ) and σ (π ). The pair (μ(π ), σ (π )) trace out a curve in the plane as πvaries from 0 to 1. Plot this curve. I need to draw a graph from this??
- A 100- m steel tape is used to measure the distance of the line and found to be 1. 539.28 m long. During measurement, the tape is supported the ends under a pull of 10 kg and the observed mean temperature is 31°C. The tape is of standard temperature of 20°C and a tension of 12 kg. The cross sectional area of the tape is 0.035 sq. cm. The coefficient of linear expansion is 0.0000116/C and the modulus of elasticity of steel is 2.0 x 10⁶ kg/ sq. cm. The tape weighs 1.5kg a) Determine the total correction for temperature. b) Determine the total correction due to sag. c) What is the correct length of the line?The pulse rates of 174 randomly selected adult males vary from a low of 36 bpm to a high of 96 bpm. Find the minimum sample size required to estimate the mean pulse rate of adult males. Assume that we want 98% confidence that the sample mean is within 2 bpm of the population mean. Complete parts (a) through (c) below. A. Find the sample size using the range rule of thumb to estimate σ. n=____ B. Assume that σ=11.5 bpm, based on the value s=11.5 bpm from the sample of 174 male pulse rates. n=___ C. Compare the results from parts (a) and (b). Which result is likely to be better?a) A given distribution has a population mean, μ, of 106 and a population standard deviation, σ, of 8. What z-score would be associated with the value x = 140? b) A given distribution has a population mean, μ, of 138 and a population standard deviation, σ, of 11. What z-score would be associated with the value x = 98? c) A given distribution has a population mean, μ, of 143 and a population standard deviation, σ, of 5. Compute the raw, x-value associated with a Z-score of -2.02. d) A given distribution has a population mean, μ, of 110 and a population standard deviation, σ, of 11. Compute the raw, x-value associated with a Z-score of 1.12. e) Suppose a population is known to be normally distributed with a mean, μ, equal to 116 and a standard deviation, σ, equal to 14. Approximately what percent of the population would be between 88 and 130? f) Suppose a population is known to be normally distributed with a mean, μ, equal to 116 and a standard deviation, σ, equal to 14.…