3. (Continuation from Chapter 4, number 5) You have learned in one of your economics courses that one of the determinants of per capita income (the "Wealth of Nations") is the population growth rate. urthermore you also found out that the Penn World Tables contain income and population data for 104 ountries of the world. To test this theory, you regress the GDP per worker (relative to the United tates) in 1990 (RelPersInc) on the difference between the average population growth rate of that ountry (n) to the U.S. average population growth rate (nus ) for the years 1980 to 1990. This results in he following regression output:
3. (Continuation from Chapter 4, number 5) You have learned in one of your economics courses that one of the determinants of per capita income (the "Wealth of Nations") is the population growth rate. urthermore you also found out that the Penn World Tables contain income and population data for 104 ountries of the world. To test this theory, you regress the GDP per worker (relative to the United tates) in 1990 (RelPersInc) on the difference between the average population growth rate of that ountry (n) to the U.S. average population growth rate (nus ) for the years 1980 to 1990. This results in he following regression output:

Linear Algebra: A Modern Introduction
4th Edition
ISBN:9781285463247
Author:David Poole
Publisher:David Poole
Chapter2: Systems Of Linear Equations
Section2.4: Applications
Problem 16EQ

Related questions

Question
the standard errors in parentheses below the coefficient estimate
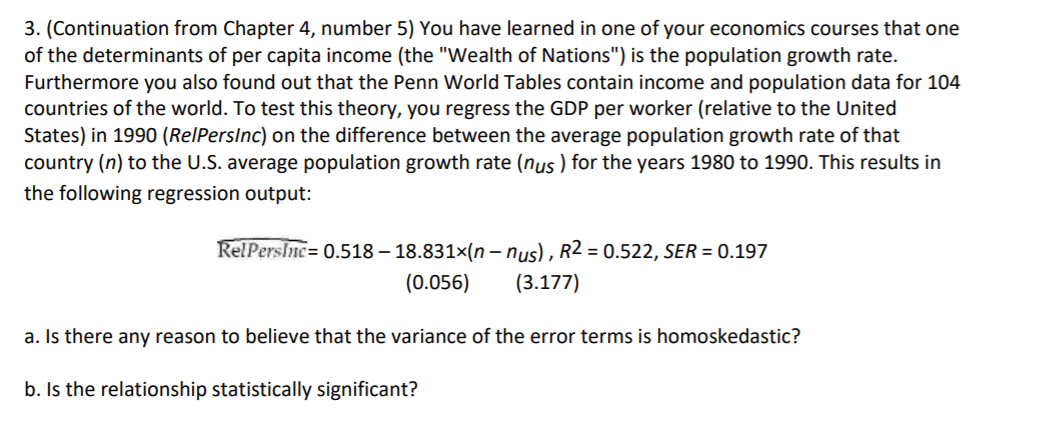
Transcribed Image Text:3. (Continuation from Chapter 4, number 5) You have learned in one of your economics courses that one
of the determinants of per capita income (the "Wealth of Nations") is the population growth rate.
Furthermore you also found out that the Penn World Tables contain income and population data for 104
countries of the world. To test this theory, you regress the GDP per worker (relative to the United
States) in 1990 (RelPersInc) on the difference between the average population growth rate of that
country (n) to the U.S. average population growth rate (nus ) for the years 1980 to 1990. This results in
the following regression output:
RelPerslne = 0.518 – 18.831×(n – nus) , R2 = 0.522, SER = 0.197
(0.056)
(3.177)
a. Is there any reason to believe that the variance of the error terms is homoskedastic?
b. Is the relationship statistically significant?
Expert Solution
This question has been solved!
Explore an expertly crafted, step-by-step solution for a thorough understanding of key concepts.

This is a popular solution!

Trending now
This is a popular solution!

Step by step
Solved in 2 steps

Knowledge Booster


Learn more about
Need a deep-dive on the concept behind this application? Look no further. Learn more about this topic, statistics and related others by exploring similar questions and additional content below.Recommended textbooks for you
Linear Algebra: A Modern Introduction
Algebra
ISBN:
9781285463247
Author:
David Poole
Publisher:
Cengage Learning

Algebra & Trigonometry with Analytic Geometry
Algebra
ISBN:
9781133382119
Author:
Swokowski
Publisher:
Cengage

Elementary Linear Algebra (MindTap Course List)
Algebra
ISBN:
9781305658004
Author:
Ron Larson
Publisher:
Cengage Learning
Linear Algebra: A Modern Introduction
Algebra
ISBN:
9781285463247
Author:
David Poole
Publisher:
Cengage Learning
Algebra & Trigonometry with Analytic Geometry
Algebra
ISBN:
9781133382119
Author:
Swokowski
Publisher:
Cengage
Elementary Linear Algebra (MindTap Course List)
Algebra
ISBN:
9781305658004
Author:
Ron Larson
Publisher:
Cengage Learning

College Algebra (MindTap Course List)
Algebra
ISBN:
9781305652231
Author:
R. David Gustafson, Jeff Hughes
Publisher:
Cengage Learning


Algebra for College Students
Algebra
ISBN:
9781285195780
Author:
Jerome E. Kaufmann, Karen L. Schwitters
Publisher:
Cengage Learning