Why do we includé à disturbănčé těrm in à regression model? (1). Some determinants of the independent variable may be omitted or left out. (II). There may be measurement errors of the dependent variables that cannot be modelled. (III). There may be random influences on the independent variable which cannot be modelled ea a burricane a co mputer failure
Why do we includé à disturbănčé těrm in à regression model? (1). Some determinants of the independent variable may be omitted or left out. (II). There may be measurement errors of the dependent variables that cannot be modelled. (III). There may be random influences on the independent variable which cannot be modelled ea a burricane a co mputer failure

College Algebra (MindTap Course List)
12th Edition
ISBN:9781305652231
Author:R. David Gustafson, Jeff Hughes
Publisher:R. David Gustafson, Jeff Hughes
Chapter6: Linear Systems
Section6.2: Guassian Elimination And Matrix Methods
Problem 84E: Explain the differences between Gaussian elimination and Gauss-Jordan elimination.

Related questions
Topic Video
Question
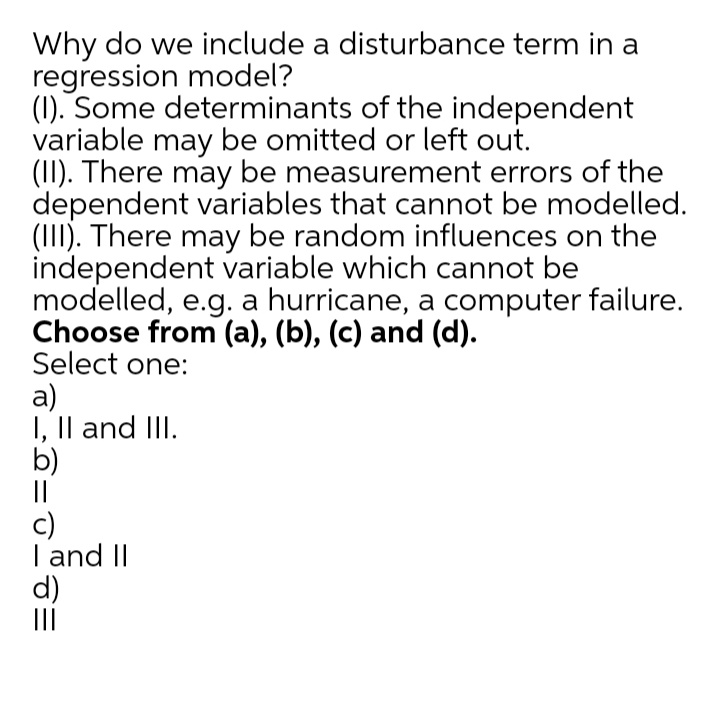
Transcribed Image Text:Why do we include a disturbance term in a
regression model?
(1). Some determinants of the independent
variable may be omitted or left out.
(II). There may be measurement errors of the
dependent variables that cannot be modelled.
(III). There may be random influences on the
independent variable which cannot be
modelled, e.g. a hurricane, a computer failure.
Choose from (a), (b), (c) and (d).
Select one:
а)
I, Il and III.
b)
||
c)
I and II
d)
II
Expert Solution
This question has been solved!
Explore an expertly crafted, step-by-step solution for a thorough understanding of key concepts.

This is a popular solution!

Trending now
This is a popular solution!

Step by step
Solved in 2 steps with 1 images

Knowledge Booster


Learn more about
Need a deep-dive on the concept behind this application? Look no further. Learn more about this topic, statistics and related others by exploring similar questions and additional content below.Recommended textbooks for you
College Algebra (MindTap Course List)
Algebra
ISBN:
9781305652231
Author:
R. David Gustafson, Jeff Hughes
Publisher:
Cengage Learning
College Algebra (MindTap Course List)
Algebra
ISBN:
9781305652231
Author:
R. David Gustafson, Jeff Hughes
Publisher:
Cengage Learning