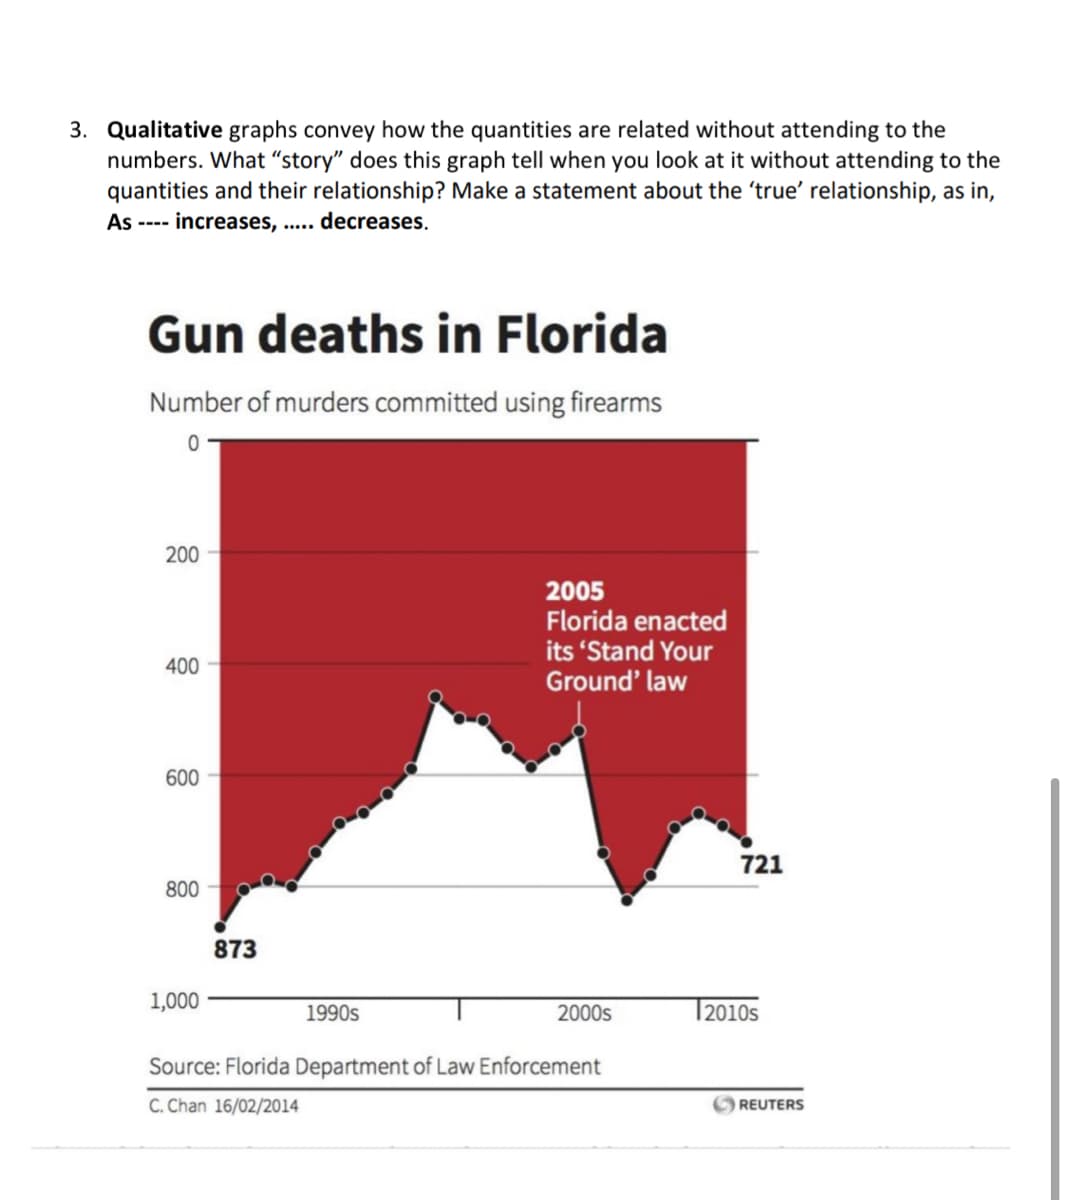
3. Qualitative graphs convey how the quantities are related without attending to the numbers. What "story" does this graph tell when you look at it without attending to the quantities and their relationship? Make a statement about the 'true' relationship, as in, As increases, .. decreases. ---- .....
Q: 14. A teacher made the following graph showing the number of hours that a student studied for an…
A: Given , A teacher made the following graph showing the numbers of hours that a student studied for…
Q: Consider the graph below, which shows the depreciation of a copy machine over 5 years. 5000 4000…
A:
Q: 43. When presenting his annual report, a businessman displayed the following graphs representing his…
A: Given: Graphs representing revenue and expenses, To find: Which one is growing faster, revenue or…
Q: September 1994, pp. 423-426. 26. Word Users According to a survey by Olsten Staffing Services, the…
A: Apologies. We only answer one question at a time. We will answer question 1 and its subparts (a),…
Q: The graph represents the volume of water in the two flasks in relation to time. 100 80 60 40 20 4 8…
A: Given that, Carmen's experiment starts with 30 milliliters of water in a flask and the water…
Q: Given the following graph, which statement is true about the change in the Jill's income? Jill's…
A:
Q: The accompanying bar graph shows the gross domestic product a certain country over a sixyear penod…
A: In the given graph , the gross domestic product in year 2 is lie between 14,000 and 15,000 The gross…
Q: 15. The following broken-line graph displays the depth of snow over a 2-day period. Depth of Snow 40…
A: To find out the rate of snow falling for first 6 hours.
Q: Every year Bloomington has a citywide relay and reports the winning times. Winning relay times 31 30…
A: topic - rate of change
Q: Does the following table of revenue data for a computer manufacturer suggest a linear relation…
A: Given that, Year 2005 2009 2011 2014 Revenue (billions of $) 13 18 15 11 Let the variable x…
Q: 11. An economist produced this graphic with an article stating that gas prices did not move much…
A: Hello. Since your question has multiple parts, we will solve first question for you. If you want…
Q: The graph in the figure below shows the unemployment percentage U = U(d) in the United States in…
A: Given: The graph in the figure shows the unemployment percentage U=U(d) in the United States in the…
Q: c. Explain how the graphs were manipulated to present an appearance that is not consistent with the…
A: the rate of change of revenue is given by 21050-2000012-1=95.4 the rate of change of expenses is…
Q: Williams Custom Sportswear 9000 8000 7000 E 6000 5000 4000 3000 2000 +2000 1000 +2001 January…
A: Red graph (2001) graph is below blue graph(2000) graph just 2 times and after that its always above…
Q: 26. Use the following graph to find the average rate of change of the U.S. trade deficit with Japan…
A: Given, Year Goods and services (in billions of dollar) 2007 84.3 2009 44.7 2011 63.2 2013…
Q: Discussion 1. Describe the trend(s) shown in your graph. 2. What is the limiting factor in this…
A: Introduction - A line graph - A line graph is a type of chart used to show information that changes…
Q: Consider the following excerpt from an article: The average person spends $ 5000.00 on traditional…
A: Two major divisions of statistics are described as descriptive statistics, through which the…
Q: The graph below shows the value of Bob's Funko Pop collection over several ye 3000x 2800 2600 2400…
A:
Q: The following scatterplot shows the relationship between a house's area (in square feet) and its…
A:
Q: he following chart shows "living wage" jobs in Rochester per 1000 working age adults over a 5 year…
A: from the given dat find out the average rate of change in the number of living wage jobs from 1997…
Q: 20. Below is an actual bar graph displayed on CNN during the Terri Schiavo controversy. The graph…
A:
Q: 5. From the following details fit a straight line trend. Year: 1989 1990 1991 1994 1995 1992 1993…
A:
Q: The following shows approximations of the leading causes of death among men ages 25-44 years. The…
A: Hi! Thank you for the question, As per the honour code, we are allowed to answer three sub-parts at…
Q: Alice traveled 30 miles in 3 hours. What graph shows the relationship between time traveled in hours…
A: Using graph
Q: 4. Examine the scatterplot below. What is this graph telling you? What conclusions can you draw, if…
A: To examine the scatter plot and answer the questions
Q: The double-bar graph shown displays the average cost of an undergraduate student's tuition, fees,…
A: For the year 2012-13 Average cost at a 2 year institution = 95 Average cost at a 4 year institution…
Q: The graph below shows the relationship between the number of years after a car is purchased and the…
A: Any point on the y-axis is read at (0,y) i.e. the x-coordinate is 0 and the value of the…
Q: Answer the question about the following quote from a news source. "The unemployment rate has risen…
A: It is given that initial unemployment rate =8.6% final unemployment rate = 6.7%
Q: This Question is continued from Question 9. The following is a graph of the profit rates for the…
A: From the given graph of profit rate and sales, we can't be sure about one option confidently. So, if…
Q: Which of these statements are correct, based on the graph below? Select all that apply.…
A: we can see from the graph that rate of increasing of no. of enrollment for women is higher than men.…
Q: 5. From the following details fit a straight line trend. Year: 1989 1994 1995 1990 1991 1992 1993…
A:
Q: Find and interpret the average rate of change illustrated in the following graph. 30 24- 18- 12-…
A:
Q: What is the relationship between the amount of time statistics students study per week and their…
A: The independent variable is Time. The dependent variable is Score. We have to find the coefficient…
Q: Does the following table of revenue data for a computer manufacturer suggest a linear relation…
A: Rate of change of revenue from 2005 to 2009 is: Rate of change of revenue from 2009 to 2011 is:…
Q: 6. Give one example of a rate that is decreasing and one example of a rate that is increasing.
A:
Q: a. What Information do you need to calculate the rate of change from the graph? 6. How could you…
A: By using the graph we find the rate of change.
Q: 4) What considerations would need to be made when determining a model of best fit for this graph?…
A: First, we need to identify any relation between dependent and independent variables.
Q: This graph shows GDP per capita for West and East Germany, Japan and Spain between 1950 and 1990.…
A:
Q: Each year, the campers at Pamela's summer camp try to set that summer's record for finishing the…
A:
Q: 8. Use a graphing calculator to determine the linear, quadratic, or exponential equation that best…
A: We will find the answer by following observations
Q: 2. The graph below shows the rate at which kids are getting in line for school lunch, measured in…
A: graph of rate at which kids are getting in line for school lunch f(t) is given. Student have gotten…
Q: 2. Portray the trend of "XXX" short-term debt since 2007 in the form of a graph. You may select the…
A:
Q: Suppose that the speed of a car, measured in miles per hour (mph), is monitored for some short…
A: Note: Hi there! Thank you for posting the question. As your question has more than 1 different…
Q: According to the United States Postal Service (in 2014), first-class letters are weighed and priced…
A: Let's Solve: Answer: Option D
Q: Given the following graph, which statement is accurate about individuals who work more than 8 hours…
A: From the given graph, For individuals more than 8 hours worked, number of gym hours increases.
Q: 1. The following graph shows the average number of fans who attend home games for the Toronto Blue…
A:
Q: Despite booming new car sales with their cha-ching sounds, the average age of vehicles on roads is…
A:
Q: Which claim can be made from the information given in the graph? Shoe Sales 35 30 25 20 15 10 Casual…
A: A graph of shoe type and percent of sales.
Q: With aging, body fat increases and muscle mass declines. The line graphs show the percent body fat…
A:
Q: The graph below shows how the amount of gas remaining is related to the number of miles driven. How…
A: see below the answer
Step by step
Solved in 2 steps with 1 images
- The Oxford Dictionary defines the word nominal asa value that is “stated or expressed but notnecessarily corresponding exactly to the real value.[18]Develop a reasonable argument for why the termnominal rate is used to describe the annual percentagerate of an investment account that compoundsinterest.Estimate the age of a newly discovered fossil for which the ratio of carbon-14 to carbon-12 is R=1/1014.Which of the following conclusions is not supported by data in the graph? 1. The ratio of biomass to fossil fuel extraction did not change that much in that time. 2. Overall, fewer tons of metals were extracted than minerals. 3. The extraction of all four types of natural resources - biomass, minerals, metals and fossils fuels - increased steadily for several decades after 1980. 4. Biomass energy is a renewable resource.
- The Fast Track Ski Shoppe sells ski goggles during the four months of the ski season.Average demand follows: a. Calculate the deseasonalized sales and the seasonal index for each of the fourmonths.b. If next year’s demand is forecast at 1200 pairs of goggles, what will be the forecast sales for each month?The Consumer Price Index (CPI) is used to measure prices relative to some base price. The Bureau of Labor Statistics maintains the index which measures prices relative to the years 1982 to 1984. The base CPI is 100 and corresponds to average prices in 1982 to 1984. Suppose the CPI for new vehicles in November 2018 was 145.025. This means that prices for new vehicles in November 2018 were 145.025% of what they were in 1982 to 1984. a) Suppose in 1984, the list price of a new Toyota Corolla was $9,129.00. Using the CPI, what would be the price of a new Toyota Corolla in November 2018? Round to the nearest cent. b) Suppose in November 2018, the list price on a base model of the Toyota Tacoma was $26,700.00. Using CPI, find the list price of a new Tacoma in 1984. Round to the nearest cent.Newell et al. 2022 observed the following relationship between precipitation p (measured in mmrainfall) on the abundance of arthropods A (measured in mg/m2 biomass) in Peru. I provided an image of the equation below (a) On what intervals does increasing precipitation increase biomass? (b) On what intervals does increasing precipitation decrease biomass? c)At what rate does increasing precipitation increase/decrease biomass in a rain forest thatreceives 500mm of rain annually?