43. When presenting his annual report, a businessman displayed the following graphs representing his department's revenue and expenses. Revenue Expenses 21,200 17,500 21,000 17,000 20,800 16.500 20,600 8 16.000 8 20,400 15,500 20,200 15,000 20,000 14,500 10 12 19,800 Months 10 12 6. Months 4. a. Which appears to be growing at a faster rate, revenue or expenses? Dollars
43. When presenting his annual report, a businessman displayed the following graphs representing his department's revenue and expenses. Revenue Expenses 21,200 17,500 21,000 17,000 20,800 16.500 20,600 8 16.000 8 20,400 15,500 20,200 15,000 20,000 14,500 10 12 19,800 Months 10 12 6. Months 4. a. Which appears to be growing at a faster rate, revenue or expenses? Dollars

Algebra & Trigonometry with Analytic Geometry
13th Edition
ISBN:9781133382119
Author:Swokowski
Publisher:Swokowski
Chapter7: Analytic Trigonometry
Section7.6: The Inverse Trigonometric Functions
Problem 94E

Related questions
Question
How do you do 43a
Transcribed Image Text:Q AA B
approximation (to the nearest hundredth) for the slope of the sides of the pyramid.
...
I C. Exercises
e; Kni.
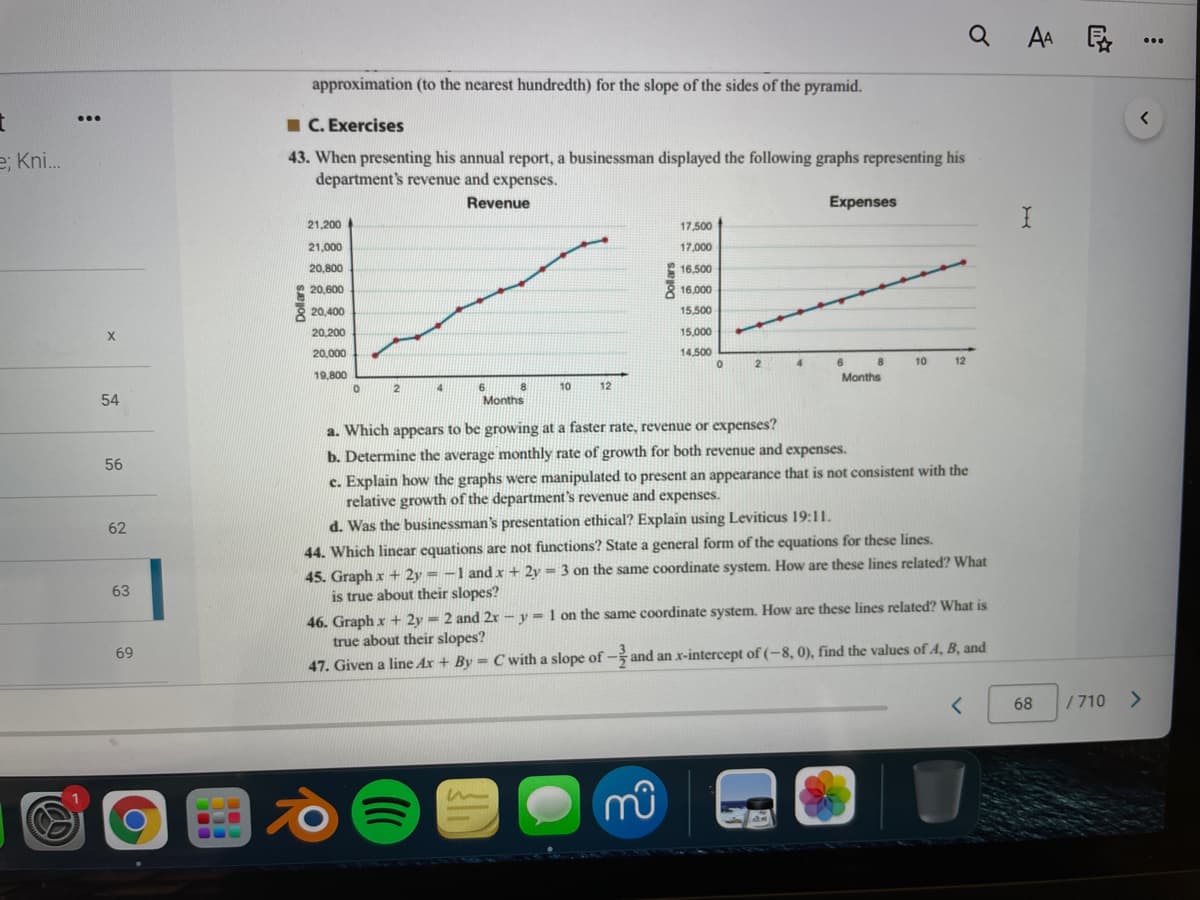
43. When presenting his annual report, a businessman displayed the following graphs representing his
department's revenue and expenses.
Revenue
Expenses
21,200
17,500
21,000
17,000
20,800
2 16,500
20,600
8 16.000
20,400
15,500
20,200
15,000
20,000
14,500
4.
10
12
19,800
Months
10
12
54
Months
a. Which appears to be growing at a faster rate, revenue or expenses?
b. Determine the average monthly rate of growth for both revenue and expenses.
56
c. Explain how the graphs were manipulated to present an appearance that is not consistent with the
relative growth of the department's revenue and expenses.
62
d. Was the businessman's presentation ethical? Explain using Leviticus 19:11.
44. Which linear equations are not functions? State a general form of the equations for these lines.
45. Graph x + 2y = -1 and x + 2y = 3 on the same coordinate system. How are these lines related? What
is true about their slopes?
46. Graph x + 2y = 2 and 2x – y = 1 on the same coordinate system. How are these lines related? What is
true about their slopes?
63
69
47. Given a line Ax + By = C with a slope of- and an x-intercept of (-8, 0), find the values of A, B, and
68
/710
Dollars
Expert Solution
This question has been solved!
Explore an expertly crafted, step-by-step solution for a thorough understanding of key concepts.

Step by step
Solved in 2 steps with 2 images

Recommended textbooks for you
Algebra & Trigonometry with Analytic Geometry
Algebra
ISBN:
9781133382119
Author:
Swokowski
Publisher:
Cengage

Functions and Change: A Modeling Approach to Coll…
Algebra
ISBN:
9781337111348
Author:
Bruce Crauder, Benny Evans, Alan Noell
Publisher:
Cengage Learning

Glencoe Algebra 1, Student Edition, 9780079039897…
Algebra
ISBN:
9780079039897
Author:
Carter
Publisher:
McGraw Hill
Algebra & Trigonometry with Analytic Geometry
Algebra
ISBN:
9781133382119
Author:
Swokowski
Publisher:
Cengage
Functions and Change: A Modeling Approach to Coll…
Algebra
ISBN:
9781337111348
Author:
Bruce Crauder, Benny Evans, Alan Noell
Publisher:
Cengage Learning
Glencoe Algebra 1, Student Edition, 9780079039897…
Algebra
ISBN:
9780079039897
Author:
Carter
Publisher:
McGraw Hill