3. Suppose you have the following model y, = Bo + B,x; +u,, i=1,...,n,n+1,..,n+ p with the classical assumptions being satisfied. You want to estimate the model using the first n number of observations and then predict the rest of the observations. a) Show that the prediction error for the n+1th observation is made up of two components, estimation error and the random disturbance term that occurs inherently in the prediction period.
3. Suppose you have the following model y, = Bo + B,x; +u,, i=1,...,n,n+1,..,n+ p with the classical assumptions being satisfied. You want to estimate the model using the first n number of observations and then predict the rest of the observations. a) Show that the prediction error for the n+1th observation is made up of two components, estimation error and the random disturbance term that occurs inherently in the prediction period.

Algebra & Trigonometry with Analytic Geometry
13th Edition
ISBN:9781133382119
Author:Swokowski
Publisher:Swokowski
Chapter10: Sequences, Series, And Probability
Section10.8: Probability
Problem 32E

Related questions
Question
100%
please only part a
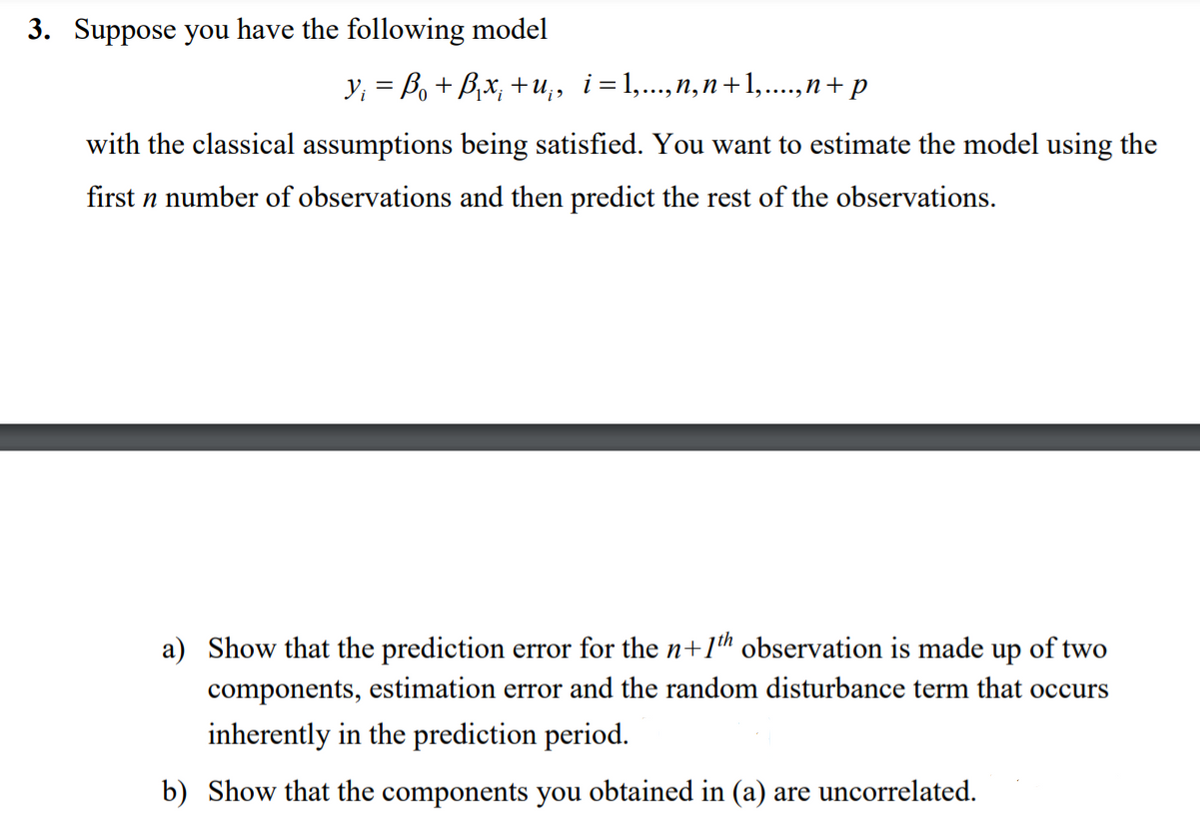
Transcribed Image Text:3. Suppose you have the following model
Y; = Bo + B,x; +u,, i=1,..,n,n+1,..,n+ p
with the classical assumptions being satisfied. You want to estimate the model using the
first n number of observations and then predict the rest of the observations.
a) Show that the prediction error for the n+1h observation is made up of two
components, estimation error and the random disturbance term that occurs
inherently in the prediction period.
b) Show that the components you obtained in (a) are uncorrelated.
Expert Solution
This question has been solved!
Explore an expertly crafted, step-by-step solution for a thorough understanding of key concepts.

This is a popular solution!

Trending now
This is a popular solution!

Step by step
Solved in 2 steps with 2 images

Knowledge Booster


Learn more about
Need a deep-dive on the concept behind this application? Look no further. Learn more about this topic, statistics and related others by exploring similar questions and additional content below.Recommended textbooks for you
Algebra & Trigonometry with Analytic Geometry
Algebra
ISBN:
9781133382119
Author:
Swokowski
Publisher:
Cengage
Algebra & Trigonometry with Analytic Geometry
Algebra
ISBN:
9781133382119
Author:
Swokowski
Publisher:
Cengage