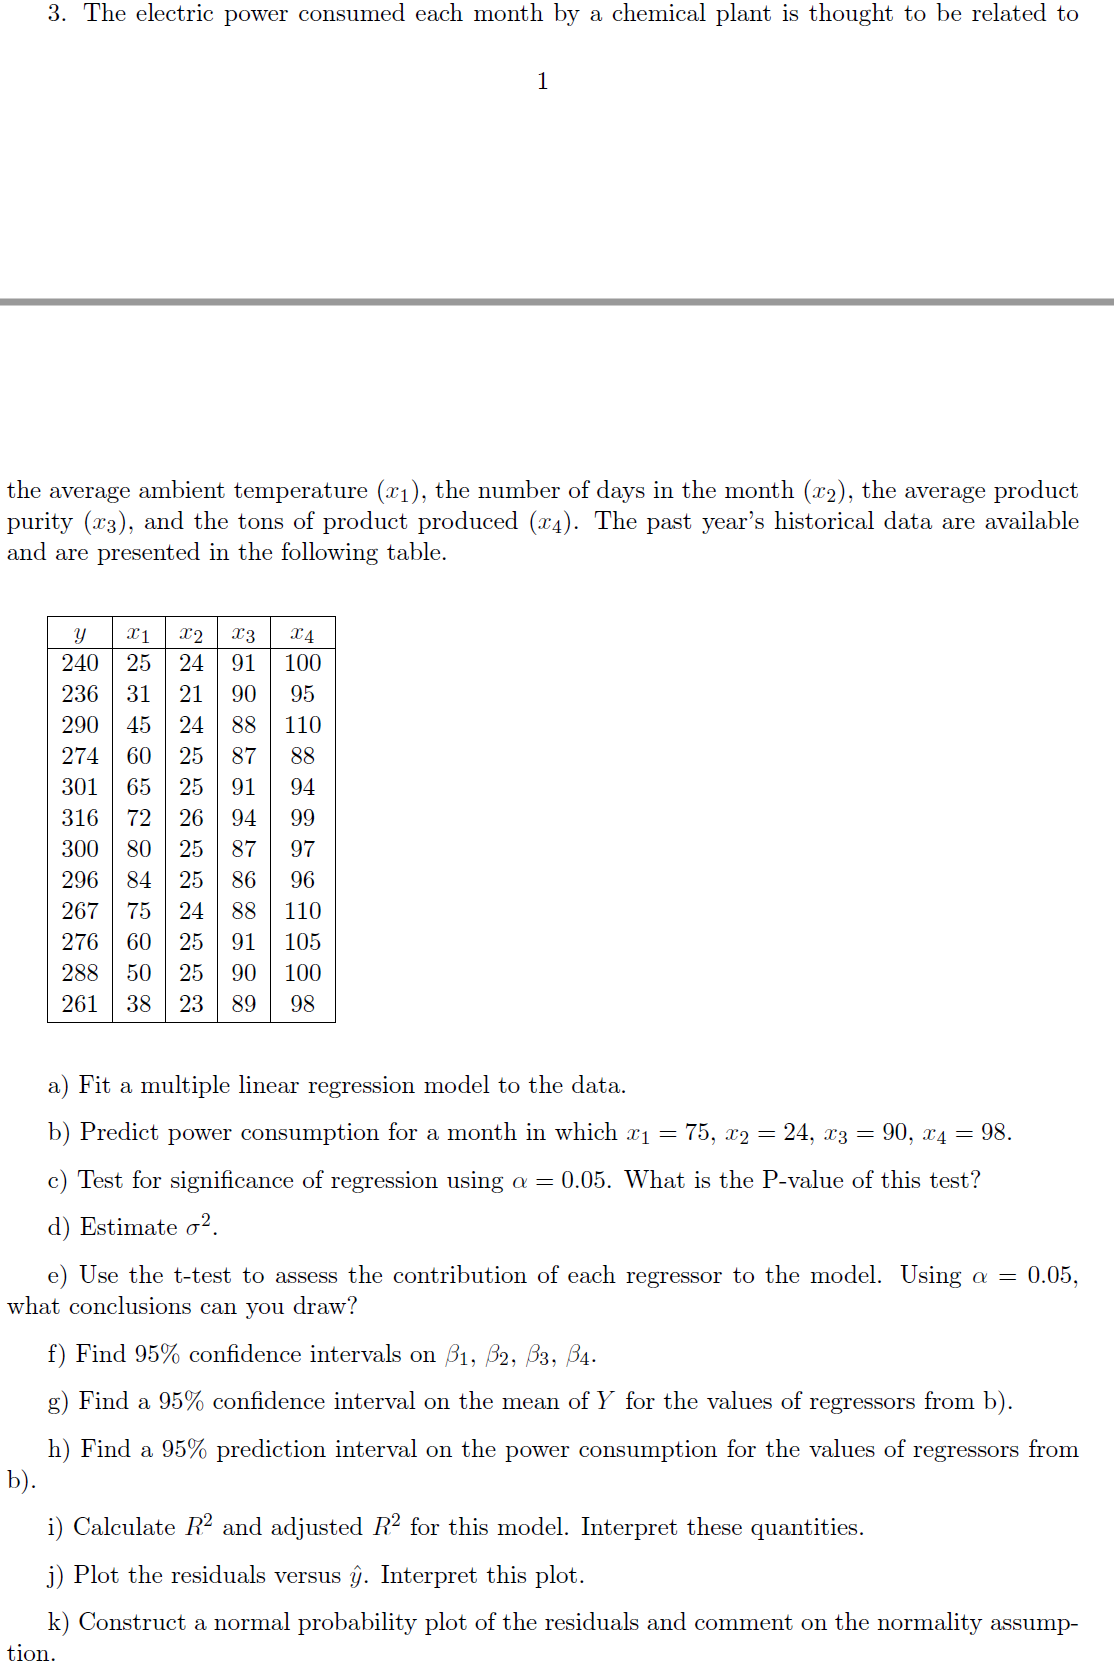
3. The electric power consumed each month by a chemical plant is thought to be related to 1 the average ambient temperature (x1), the number of days in the month (x2), the average product purity (x3), and the tons of product produced (x4). The past year's historical data are available and are presented in the following table. x2 x3 X4 240 25 24 91 100 236 31 21 90 95 290 45 24 88 110 274 60 25 87 88 301 65 25 91 94 316 72 26 94 99 300 80 25 87 97 296 84 25 86 96 267 75 24 88 110 276 60 25 91 105 288 50 25 90 100 261 38 23 89 98 a) Fit a multiple linear regression model to the data. b) Predict power consumption for a month in which r1 = 75, 29 — 24, х3 — 90, х4 — 98. c) Test for significance of regression using a = 0.05. What is the P-value of this test? d) Estimate o². e) Use the t-test to assess the contribution of each regressor to the model. Using a what conclusions can you draw? 0.05, f) Find 95% confidence intervals on B1, B2, B3, B4. g) Find a 95% confidence interval on the mean of Y for the values of regressors from b). h) Find a 95% prediction interval on the power consumption for the values of regressors from b). i) Calculate R2 and adjusted R2 for this model. Interpret these quantities. j) Plot the residuals versus îŷ. Interpret this plot. k) Construct a normal probability plot of the residuals and comment on the normality assump- tion.
3. The electric power consumed each month by a chemical plant is thought to be related to 1 the average ambient temperature (x1), the number of days in the month (x2), the average product purity (x3), and the tons of product produced (x4). The past year's historical data are available and are presented in the following table. x2 x3 X4 240 25 24 91 100 236 31 21 90 95 290 45 24 88 110 274 60 25 87 88 301 65 25 91 94 316 72 26 94 99 300 80 25 87 97 296 84 25 86 96 267 75 24 88 110 276 60 25 91 105 288 50 25 90 100 261 38 23 89 98 a) Fit a multiple linear regression model to the data. b) Predict power consumption for a month in which r1 = 75, 29 — 24, х3 — 90, х4 — 98. c) Test for significance of regression using a = 0.05. What is the P-value of this test? d) Estimate o². e) Use the t-test to assess the contribution of each regressor to the model. Using a what conclusions can you draw? 0.05, f) Find 95% confidence intervals on B1, B2, B3, B4. g) Find a 95% confidence interval on the mean of Y for the values of regressors from b). h) Find a 95% prediction interval on the power consumption for the values of regressors from b). i) Calculate R2 and adjusted R2 for this model. Interpret these quantities. j) Plot the residuals versus îŷ. Interpret this plot. k) Construct a normal probability plot of the residuals and comment on the normality assump- tion.

College Algebra
7th Edition
ISBN:9781305115545
Author:James Stewart, Lothar Redlin, Saleem Watson
Publisher:James Stewart, Lothar Redlin, Saleem Watson
Chapter1: Equations And Graphs
Section: Chapter Questions
Problem 10T: Olympic Pole Vault The graph in Figure 7 indicates that in recent years the winning Olympic men’s...

Related questions
Question
100%
Kindly help me understand d) e) f) and the answers for a) b) c) are also in the attached picture for reference. I do not know why are my questions being rejected? The person who solved a) b) c) should obviously know how to solve the rest. I am having trouble in the question and therefore asking for HELP.
Transcribed Image Text:3. The electric power consumed each month by a chemical plant is thought to be related to
1
the average ambient temperature (x1), the number of days in the month (x2), the average product
purity (x3), and the tons of product produced (x4). The past year's historical data are available
and are presented in the following table.
x2
x3
X4
240
25
24
91
100
236
31
21
90
95
290
45
24
88
110
274
60
25
87
88
301
65
25
91
94
316
72
26
94
99
300
80
25
87
97
296
84
25
86
96
267
75
24
88
110
276
60
25
91
105
288
50
25
90
100
261
38
23
89
98
a) Fit a multiple linear regression model to the data.
b) Predict power consumption for a month in which r1 =
75, 29 — 24, х3 — 90, х4 — 98.
c) Test for significance of regression using a = 0.05. What is the P-value of this test?
d) Estimate o².
e) Use the t-test to assess the contribution of each regressor to the model. Using a
what conclusions can you draw?
0.05,
f) Find 95% confidence intervals on B1, B2, B3, B4.
g) Find a 95% confidence interval on the mean of Y for the values of regressors from b).
h) Find a 95% prediction interval on the power consumption for the values of regressors from
b).
i) Calculate R2 and adjusted R2 for this model. Interpret these quantities.
j) Plot the residuals versus îŷ. Interpret this plot.
k) Construct a normal probability plot of the residuals and comment on the normality assump-
tion.

Expert Solution
This question has been solved!
Explore an expertly crafted, step-by-step solution for a thorough understanding of key concepts.

This is a popular solution!

Trending now
This is a popular solution!

Step by step
Solved in 4 steps with 3 images

Knowledge Booster


Learn more about
Need a deep-dive on the concept behind this application? Look no further. Learn more about this topic, statistics and related others by exploring similar questions and additional content below.Recommended textbooks for you
College Algebra
Algebra
ISBN:
9781305115545
Author:
James Stewart, Lothar Redlin, Saleem Watson
Publisher:
Cengage Learning

Algebra & Trigonometry with Analytic Geometry
Algebra
ISBN:
9781133382119
Author:
Swokowski
Publisher:
Cengage

Algebra and Trigonometry (MindTap Course List)
Algebra
ISBN:
9781305071742
Author:
James Stewart, Lothar Redlin, Saleem Watson
Publisher:
Cengage Learning
College Algebra
Algebra
ISBN:
9781305115545
Author:
James Stewart, Lothar Redlin, Saleem Watson
Publisher:
Cengage Learning
Algebra & Trigonometry with Analytic Geometry
Algebra
ISBN:
9781133382119
Author:
Swokowski
Publisher:
Cengage
Algebra and Trigonometry (MindTap Course List)
Algebra
ISBN:
9781305071742
Author:
James Stewart, Lothar Redlin, Saleem Watson
Publisher:
Cengage Learning

Functions and Change: A Modeling Approach to Coll…
Algebra
ISBN:
9781337111348
Author:
Bruce Crauder, Benny Evans, Alan Noell
Publisher:
Cengage Learning

Trigonometry (MindTap Course List)
Trigonometry
ISBN:
9781305652224
Author:
Charles P. McKeague, Mark D. Turner
Publisher:
Cengage Learning