3. The nation of Routarou is able to produce turnips and potatoes in combinations represented by the data in the following table. Each number represents thousands of bushels. A B D E Turnips 100 90 70 40 Potatoes 10 20 30 40 Plot this data on a production possibilities graph and explain why the data shows that Routarou experiences increasing opportunity costs.
3. The nation of Routarou is able to produce turnips and potatoes in combinations represented by the data in the following table. Each number represents thousands of bushels. A B D E Turnips 100 90 70 40 Potatoes 10 20 30 40 Plot this data on a production possibilities graph and explain why the data shows that Routarou experiences increasing opportunity costs.

Chapter2: Economic Tools And Economic Systems
Section: Chapter Questions
Problem 3.5P

Related questions

Question
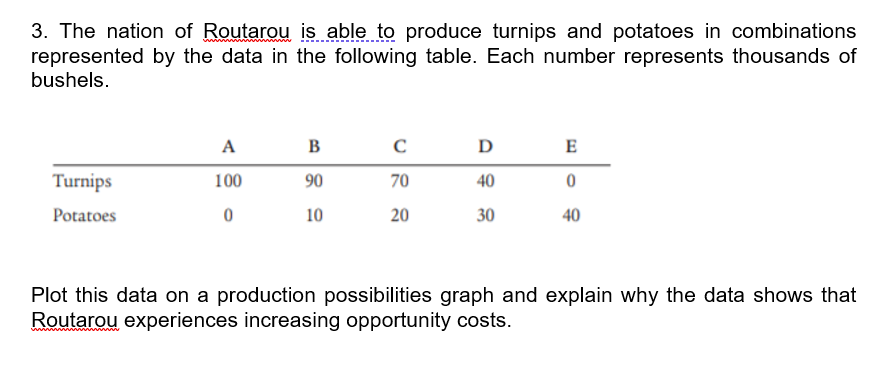
Transcribed Image Text:3. The nation of Routarou is able to produce turnips and potatoes in combinations
represented by the data in the following table. Each number represents thousands of
bushels.
A
B
D
E
Turnips
100
90
70
40
Potatoes
10
20
30
40
Plot this data on a production possibilities graph and explain why the data shows that
Routarou experiences increasing opportunity costs.
Expert Solution
This question has been solved!
Explore an expertly crafted, step-by-step solution for a thorough understanding of key concepts.

This is a popular solution!

Trending now
This is a popular solution!

Step by step
Solved in 2 steps with 1 images

Knowledge Booster


Learn more about
Need a deep-dive on the concept behind this application? Look no further. Learn more about this topic, economics and related others by exploring similar questions and additional content below.Recommended textbooks for you

Essentials of Economics (MindTap Course List)
Economics
ISBN:
9781337091992
Author:
N. Gregory Mankiw
Publisher:
Cengage Learning

Brief Principles of Macroeconomics (MindTap Cours…
Economics
ISBN:
9781337091985
Author:
N. Gregory Mankiw
Publisher:
Cengage Learning
Essentials of Economics (MindTap Course List)
Economics
ISBN:
9781337091992
Author:
N. Gregory Mankiw
Publisher:
Cengage Learning
Brief Principles of Macroeconomics (MindTap Cours…
Economics
ISBN:
9781337091985
Author:
N. Gregory Mankiw
Publisher:
Cengage Learning


Principles of Economics 2e
Economics
ISBN:
9781947172364
Author:
Steven A. Greenlaw; David Shapiro
Publisher:
OpenStax