3. Using MIL-STD, determine the single sampling plans for the following information: Inspection Tightened Number Inspection Level AQL Lot Size 1.5% 1,400 2 Normal 6.5% 115 160,000 27 3 II Reduced 0.40% 4 II Normal 2.5% NOTE: Sampling plan should contain Inspection Type - whether normal etc. AQL N= lot size, n= sample size, c= acceptance number r= rejection number
3. Using MIL-STD, determine the single sampling plans for the following information: Inspection Tightened Number Inspection Level AQL Lot Size 1.5% 1,400 2 Normal 6.5% 115 160,000 27 3 II Reduced 0.40% 4 II Normal 2.5% NOTE: Sampling plan should contain Inspection Type - whether normal etc. AQL N= lot size, n= sample size, c= acceptance number r= rejection number

Practical Management Science
6th Edition
ISBN:9781337406659
Author:WINSTON, Wayne L.
Publisher:WINSTON, Wayne L.
Chapter14: Data Mining
Section14.2: Classification Methods
Problem 11P

Related questions

Question
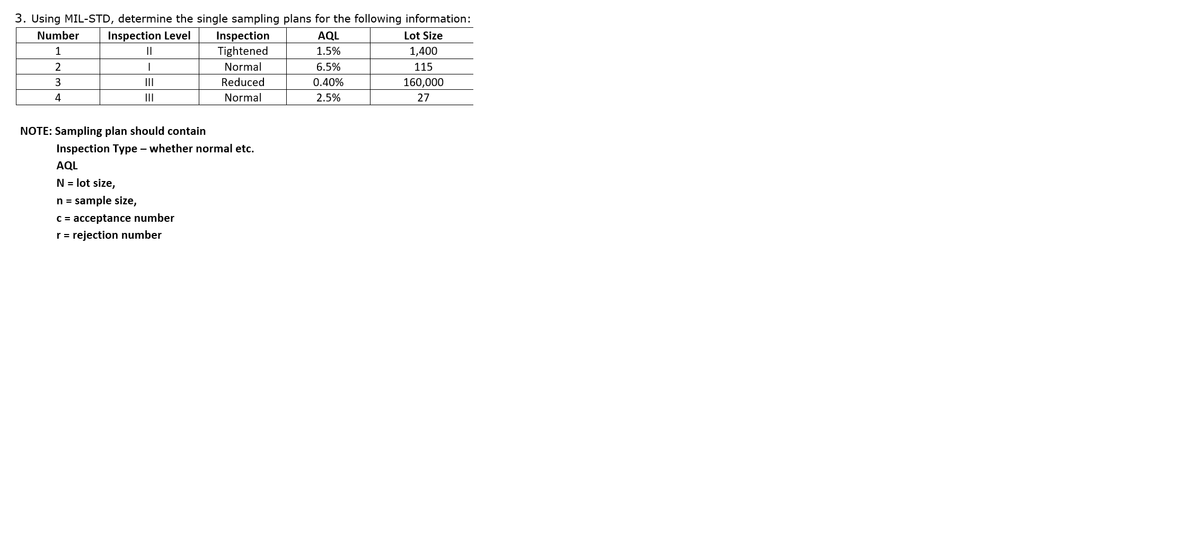
Transcribed Image Text:3. Using MIL-STD, determine the single sampling plans for the following information:
Number
Inspection
Tightened
Normal
Inspection Level
AQL
Lot Size
1
1.5%
1,400
2
6.5%
115
3
II
Reduced
0.40%
160,000
4
II
Normal
2.5%
27
NOTE: Sampling plan should contain
Inspection Type – whether normal etc.
AQL
N = lot size,
n = sample size,
C = acceptance number
r = rejection number
Expert Solution
This question has been solved!
Explore an expertly crafted, step-by-step solution for a thorough understanding of key concepts.

This is a popular solution!

Trending now
This is a popular solution!

Step by step
Solved in 2 steps with 5 images

Knowledge Booster


Learn more about
Need a deep-dive on the concept behind this application? Look no further. Learn more about this topic, operations-management and related others by exploring similar questions and additional content below.Recommended textbooks for you
Practical Management Science
Operations Management
ISBN:
9781337406659
Author:
WINSTON, Wayne L.
Publisher:
Cengage,
Practical Management Science
Operations Management
ISBN:
9781337406659
Author:
WINSTON, Wayne L.
Publisher:
Cengage,