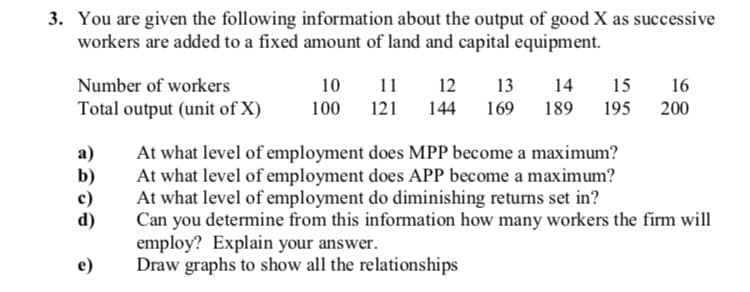
3. You are given the following information about the output of good X as successive workers are added to a fixed amount of land and capital equipment. Number of workers 10 11 12 13 14 15 16 Total output (unit of X) 100 121 144 169 189 195 200 At what level of employment does MPP become a maximum? At what level of employment does APP become a maximum? At what level of employment do diminishing returns set in? Can you determine from this information how many workers the firm will employ? Explain your answer. Draw graphs to show all the relationships а) b) c) d) e)
3. You are given the following information about the output of good X as successive workers are added to a fixed amount of land and capital equipment. Number of workers 10 11 12 13 14 15 16 Total output (unit of X) 100 121 144 169 189 195 200 At what level of employment does MPP become a maximum? At what level of employment does APP become a maximum? At what level of employment do diminishing returns set in? Can you determine from this information how many workers the firm will employ? Explain your answer. Draw graphs to show all the relationships а) b) c) d) e)

Microeconomics: Private and Public Choice (MindTap Course List)
16th Edition
ISBN:9781305506893
Author:James D. Gwartney, Richard L. Stroup, Russell S. Sobel, David A. Macpherson
Publisher:James D. Gwartney, Richard L. Stroup, Russell S. Sobel, David A. Macpherson
Chapter13: Earnings, Productivity, And The Job Market
Section: Chapter Questions
Problem 11CQ

Related questions
Question
100%
Transcribed Image Text:3. You are given the following information about the output of good X as successive
workers are added to a fixed amount of land and capital equipment.
11
121
Number of workers
10
12
13
14
15
16
Total output (unit of X)
100
144
169
189
195
200
At what level of employment does MPP become a maximum?
At what level of employment does APP become a maximum?
At what level of employment do diminishing returns set in?
Can you determine from this information how many workers the firm will
employ? Explain your answer.
Draw graphs to show all the relationships
a)
e)
Expert Solution
This question has been solved!
Explore an expertly crafted, step-by-step solution for a thorough understanding of key concepts.

Step by step
Solved in 2 steps

Knowledge Booster


Learn more about
Need a deep-dive on the concept behind this application? Look no further. Learn more about this topic, economics and related others by exploring similar questions and additional content below.Recommended textbooks for you
Microeconomics: Private and Public Choice (MindTa…
Economics
ISBN:
9781305506893
Author:
James D. Gwartney, Richard L. Stroup, Russell S. Sobel, David A. Macpherson
Publisher:
Cengage Learning

Economics: Private and Public Choice (MindTap Cou…
Economics
ISBN:
9781305506725
Author:
James D. Gwartney, Richard L. Stroup, Russell S. Sobel, David A. Macpherson
Publisher:
Cengage Learning

Microeconomics: Private and Public Choice (MindTa…
Economics
ISBN:
9781305506893
Author:
James D. Gwartney, Richard L. Stroup, Russell S. Sobel, David A. Macpherson
Publisher:
Cengage Learning
Economics: Private and Public Choice (MindTap Cou…
Economics
ISBN:
9781305506725
Author:
James D. Gwartney, Richard L. Stroup, Russell S. Sobel, David A. Macpherson
Publisher:
Cengage Learning

Principles of Microeconomics
Economics
ISBN:
9781305156050
Author:
N. Gregory Mankiw
Publisher:
Cengage Learning

Macroeconomics: Private and Public Choice (MindTa…
Economics
ISBN:
9781305506756
Author:
James D. Gwartney, Richard L. Stroup, Russell S. Sobel, David A. Macpherson
Publisher:
Cengage Learning

Principles of Economics 2e
Economics
ISBN:
9781947172364
Author:
Steven A. Greenlaw; David Shapiro
Publisher:
OpenStax