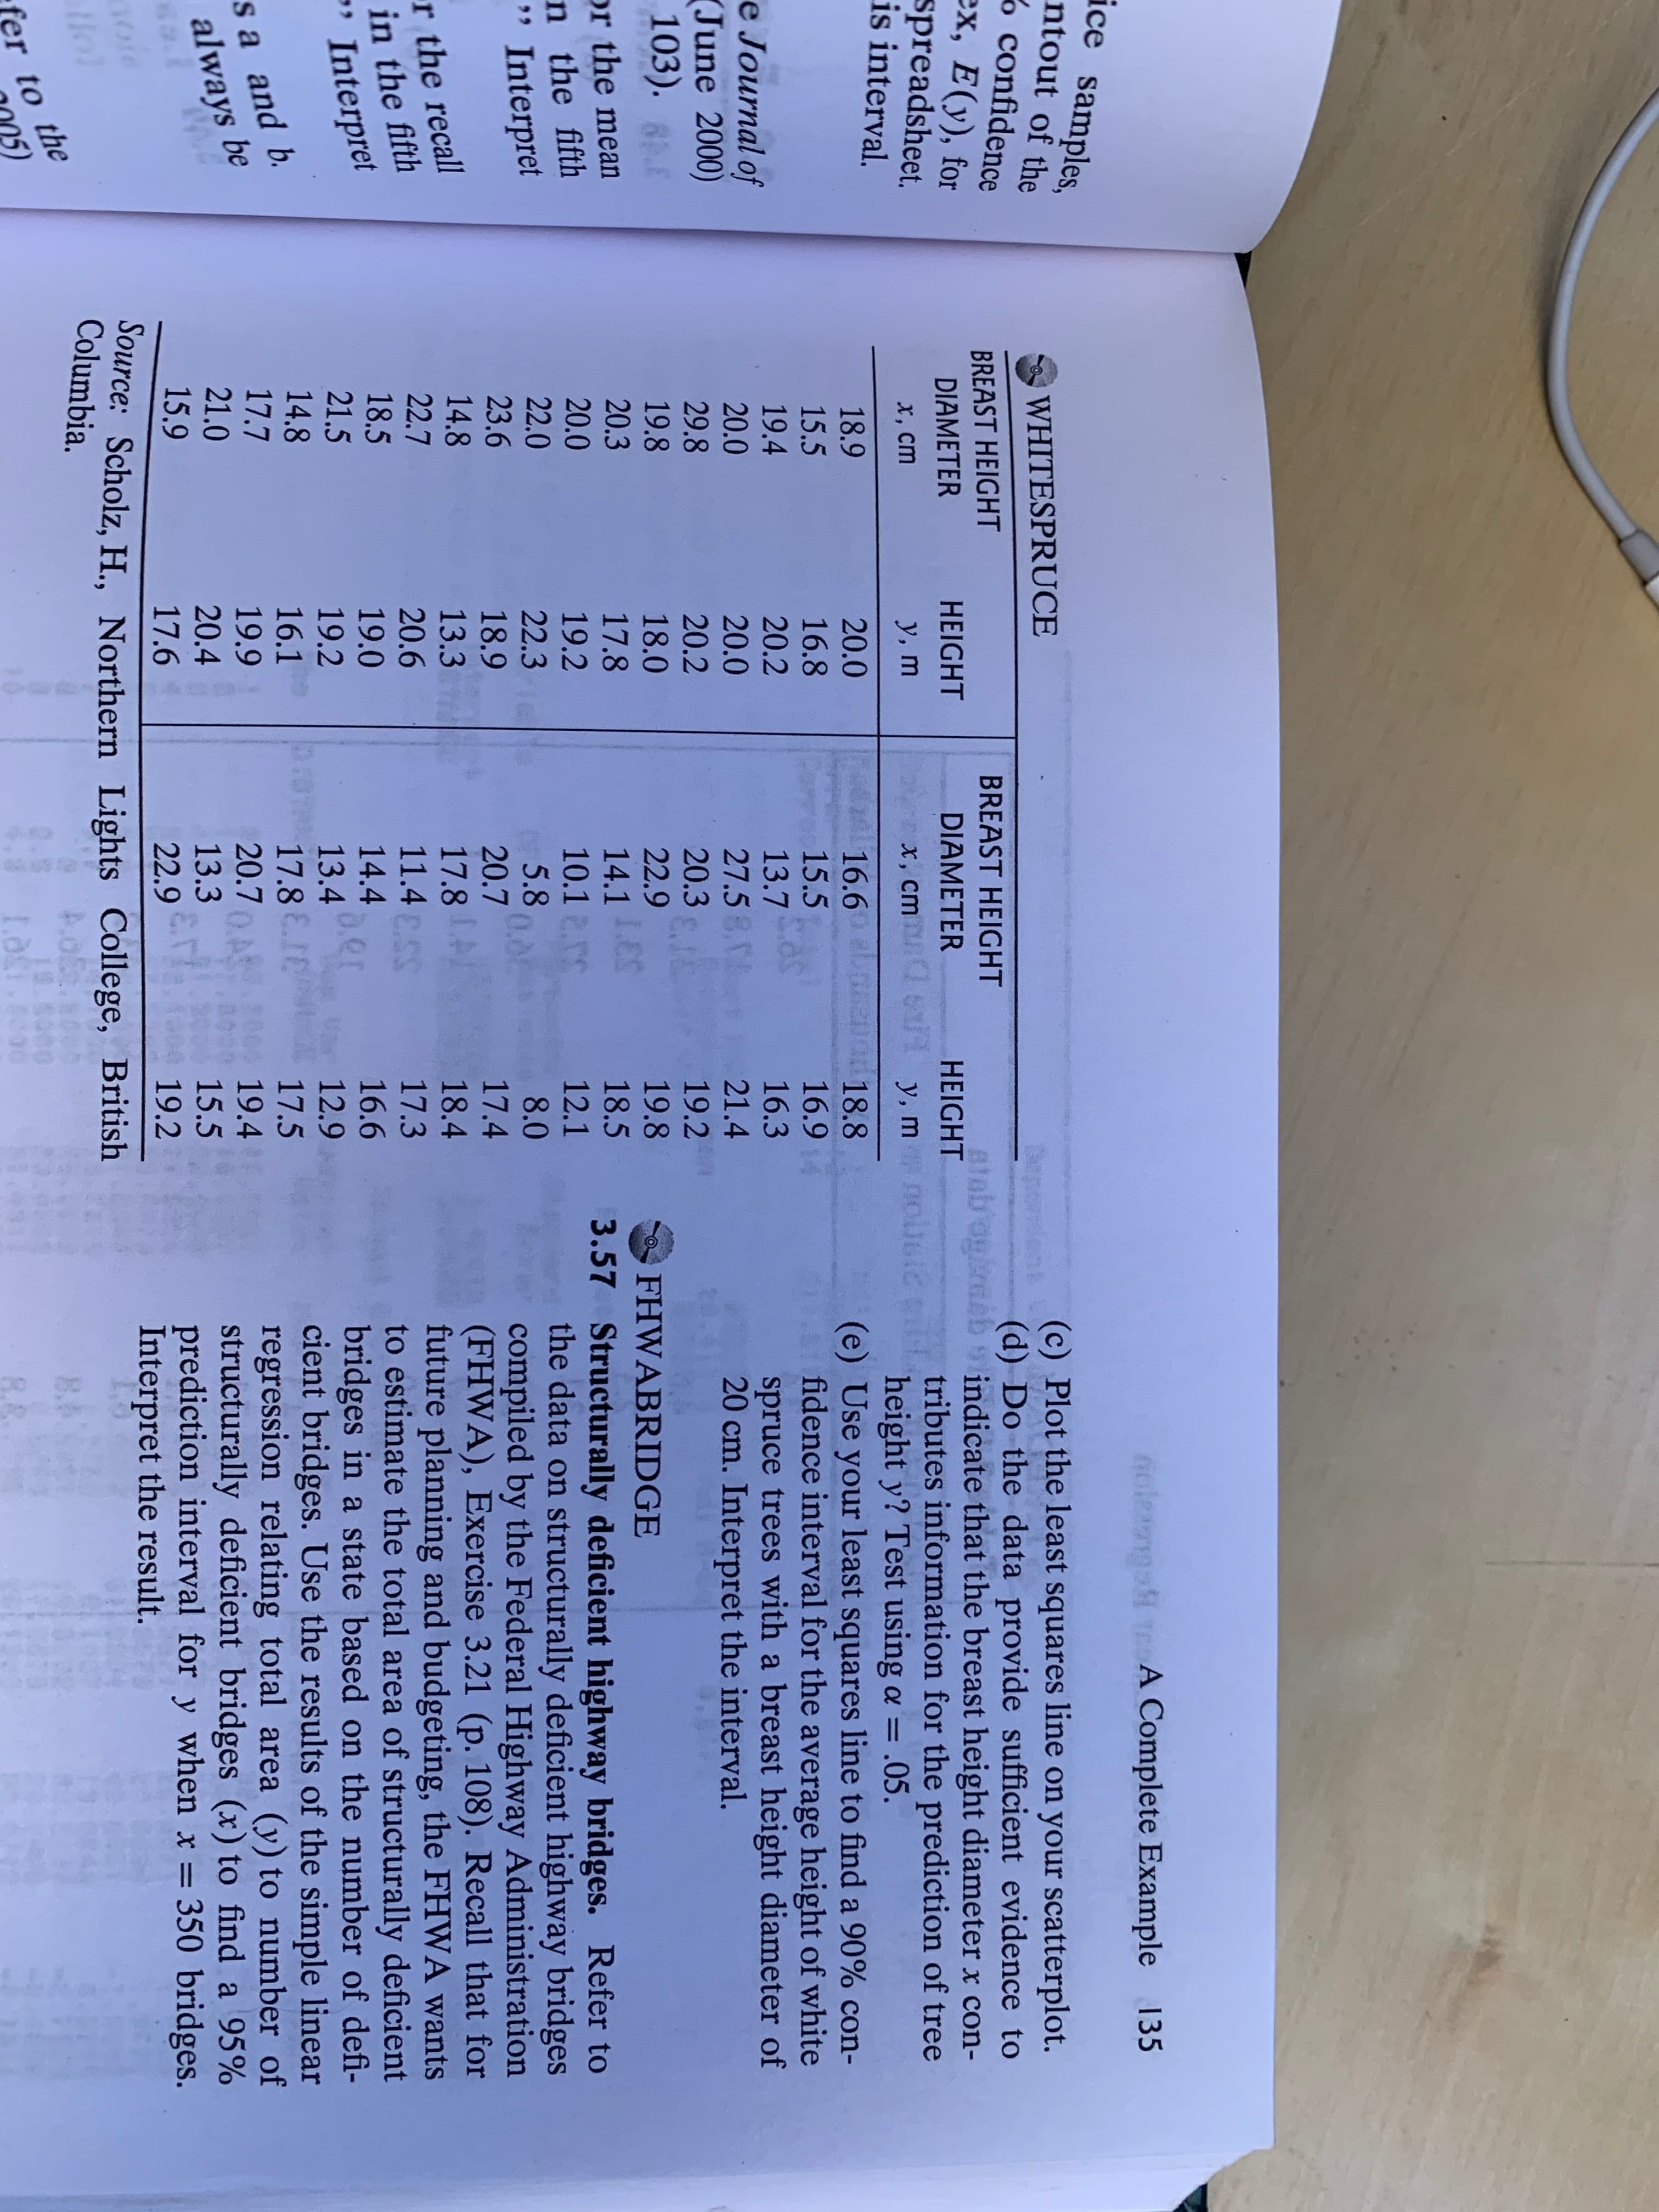
3.56 Predicting heights of spruce trees. In forestry, the 1o b diameter of a tree at breast height (which is fairly easy to measure) is used to predict the height of the tree (a difficult measurement to obtain). Sil. viculturists working in British Columbia's boreal forest conducted a series of spacing trials to predict the heights of several species of trees. The data in the next table are the breast height diameters (in centimeters) and heights (in meters) for a sample boat of 36 white spruce trees. (a) Construct a scatterplot for the data. (b) Assuming the relationship between the vari- ables is best described by a straight line, use the method of least squares to estimate the ELU y-intercept and slope of the line. al for a limt on Its wi you nolega te A Complete Example 135 ice samples, ntout of the (c) Plot the least squares line on your scatterplot. (d) Do the data provide sufficient evidence to AtabogireAb s indicate that the breast height diameter x con- tributes information for the prediction of tree = .05. (e) Use your least squares line to find a 90% con- fidence interval for the average height of white spruce trees with a breast height diameter of 20 cm. Interpret the interval. WHITESPRUCE %confidence ex, E(y), for spreadsheet. is interval. BREAST HEIGHT BREAST HEIGHT DIAMETER HEIGHT DIAMETER HEIGHT y, m x, cm e y, mnoueCA х, ст height y? Test using a = 20.0 16.6 15.5 18.9 18.8 16.8 15.5 19.4 20.0 16.9 16.3 20.2 13.7 e Journal of (June 2000) 103). 20.0 27.5 21.4 29.8 20.2 20.3 19.2 19.8 18.0 17.8 22.9 19.8 FHWABRIDGE 20.3 20.0 22.0 14.1 ES 10.1.S 5.80. or the mean n the fifth " Interpret 18.5 12.1 3.57 Structurally deficient highway bridges. Refer to the data on structurally deficient highway bridges compiled by the Federal Highway Administration (FHWA), Exercise 3.21 (p. 108). Recall that for future planning and budgeting, the FHWA wants to estimate the total area of structurally deficient bridges in a state based on the number of defi- cient bridges. Use the results of the simple linear regression relating total area (y) to number of structurally deficient bridges (x) to find a 95% prediction interval for y when x = 350 bridges. Interpret the result. 19.2 22.3 8.0 23.6 20.7 17.4 18.4 18.9 17.8LA 11.4 ESS 14.4 a.er 13.4 14.8 r the recall in the fifth " Interpret 13.3 22.7 18.5 20.6 17.3 16.6 21.5 14.8 19.0 19.2 16.1 12.9 sa and b. always be 17.8 E 20.7A 17.5 17.7 21.0 19.9 19.4 20.4 17.6 13.3 15.5 19.2 15.9 22.9 Source: Scholz, H., Northern Lights College, British Columbia. llol 8.A er to the


Addition Rule of Probability
It simply refers to the likelihood of an event taking place whenever the occurrence of an event is uncertain. The probability of a single event can be calculated by dividing the number of successful trials of that event by the total number of trials.
Expected Value
When a large number of trials are performed for any random variable ‘X’, the predicted result is most likely the mean of all the outcomes for the random variable and it is known as expected value also known as expectation. The expected value, also known as the expectation, is denoted by: E(X).
Probability Distributions
Understanding probability is necessary to know the probability distributions. In statistics, probability is how the uncertainty of an event is measured. This event can be anything. The most common examples include tossing a coin, rolling a die, or choosing a card. Each of these events has multiple possibilities. Every such possibility is measured with the help of probability. To be more precise, the probability is used for calculating the occurrence of events that may or may not happen. Probability does not give sure results. Unless the probability of any event is 1, the different outcomes may or may not happen in real life, regardless of how less or how more their probability is.
Basic Probability
The simple definition of probability it is a chance of the occurrence of an event. It is defined in numerical form and the probability value is between 0 to 1. The probability value 0 indicates that there is no chance of that event occurring and the probability value 1 indicates that the event will occur. Sum of the probability value must be 1. The probability value is never a negative number. If it happens, then recheck the calculation.
Problem 3.56
part a, b, c, d, e (95% confidence interval for part e)


Trending now
This is a popular solution!

Step by step
Solved in 4 steps with 2 images


