3.Construct a grouped frequency distribution with 8 classes. Also find out cumulative frequencies and relative frequencies.
3.Construct a grouped frequency distribution with 8 classes. Also find out cumulative frequencies and relative frequencies.

Glencoe Algebra 1, Student Edition, 9780079039897, 0079039898, 2018
18th Edition
ISBN:9780079039897
Author:Carter
Publisher:Carter
Chapter10: Statistics
Section10.6: Summarizing Categorical Data
Problem 4CGP

Related questions
Question
100%
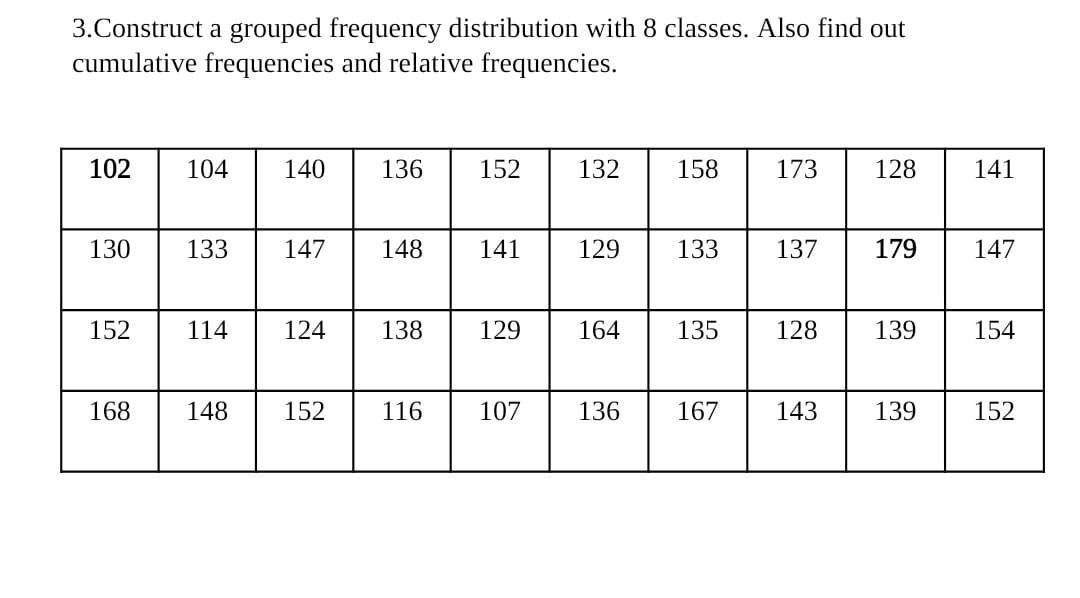
Transcribed Image Text:3.Construct a grouped frequency distribution with 8 classes. Also find out
cumulative frequencies and relative frequencies.
102
104
140
136
152
132
158
173
128
141
130
133
147
148
141
129
133
137
179
147
152
114
124
138
129
164
135
128
139
154
168
148
152
116
107
136
167
143
139
152
Expert Solution
This question has been solved!
Explore an expertly crafted, step-by-step solution for a thorough understanding of key concepts.

This is a popular solution!

Trending now
This is a popular solution!

Step by step
Solved in 2 steps with 2 images

Knowledge Booster


Learn more about
Need a deep-dive on the concept behind this application? Look no further. Learn more about this topic, statistics and related others by exploring similar questions and additional content below.Recommended textbooks for you
Glencoe Algebra 1, Student Edition, 9780079039897…
Algebra
ISBN:
9780079039897
Author:
Carter
Publisher:
McGraw Hill
Glencoe Algebra 1, Student Edition, 9780079039897…
Algebra
ISBN:
9780079039897
Author:
Carter
Publisher:
McGraw Hill