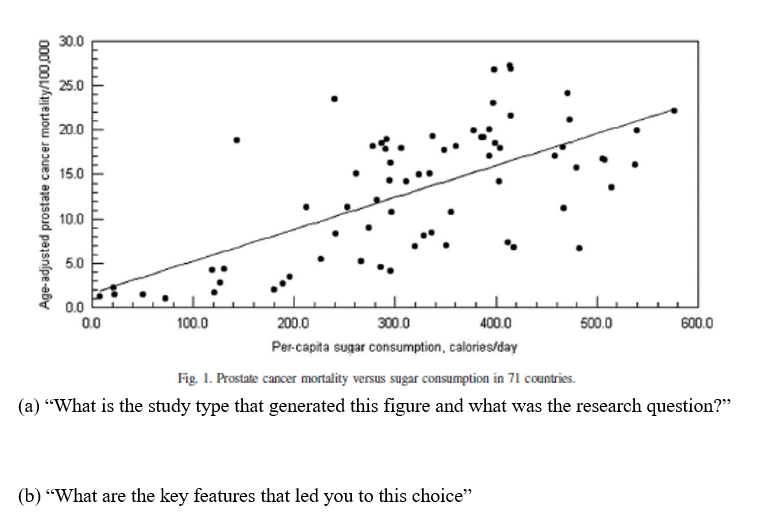
30.0 25.0 20.0 15.0 10.0 5.0 0.0 0.0 100.0 200.0 300.0 400.0 500.0 600.0 Per-capita sugar consumption, calories/day Fig. 1. Prostate cancer mortality versus sugar consumption in 71 countries. a) “What is the study type that generated this figure and what was the research question?" b) “What are the key features that led you to this choice" Age-adjusted prostate cancer mortality/100,000


Q: Predict the annual salary in dollars for a mathematics instructor with 10 years of experience.…
A:
Q: 4. The table below gives the purchasing power of the dollar as measured by consumer prices according…
A: Given data, Year Consumer prices 1983 1.003 1984 0.961 1985 0.928 1986 0.913 1987 0.88…
Q: Question No: Engro group, who recently sold its Engro foods start-up for a multi-million-rupees sum,…
A: Hello! Thankyou for the question, As per the honor code, we are allowed to answer three sub parts at…
Q: Sex Mean hemoglobin level SD of hemoglobin level Population 1: Men 14.4 2 Population 2: Women 13.1…
A: We have given that the two populations men and women means and standard deviations are given in the…
Q: 3. From the figures given below calculate the General Fertility Rate and the Total Fertility Rate :…
A:
Q: 3. According to a Los Angeles Times study of more than 1 million medical dispatches from 2007 to…
A: The mean is the average value of the data and mode is the value that has highest frequency in the…
Q: Table 1. Survivorship table Number of deaths (D) # Of individuals who died during interval Age…
A: “Since you have posted a question with multiple sub-parts, we will solve first three sub-parts for…
Q: A developmental psychologist working in the area of suggestion asked a sample of children to solve…
A: Given data Problem Solving Time-filling 3 10 4 5 7 8 4 7 2 9…
Q: Tar (mg) in Nonfiltered Cigarettes Frequency 15-20 21-26 27-32 33-38 39-44 Tar (mg) in Filtered…
A: Relative Frequency= Frequency of class/ Total frequency Total frequency for Nonfiltered…
Q: Which of the following is NOT one of the main sections of most research papers in the behavioral and…
A: Given problem Given that Which of the following is NOT one of the main sections of most research…
Q: How does the average height for boys change as boys get older? According to the Physician's…
A: Given data is Age(Years) 0.5 1 2 3 4 5 6 7 8 9 10 11 12 13 14 Height(Inches) 26 29 33 36 39 42…
Q: Measurement of anxiety levels. Before Deeep Breathing 20 19 15 13 12 11 After Deep Breathing 14 15…
A: Null Hypothesis : There is no significant difference between before and after deep breathing.
Q: The hypothetical data in the table below displays the percentage that unemployment benefits replace…
A: The hypothetical data in the table shows the percentage that unemployment benefits replace take-home…
Q: 3.9 Kenya 55 380 2.9 6.8 Indonesia 35 530 4.1 3.4 Panama 30 1910 3.1 8.6 Chile 25…
A: Country Birth rate GNP Growth Income ratio Bangladesh 47 140 0.3 2.3 Tanzania 47 280 1.9 3.2…
Q: 2)- Industrial engineers periodically conduct "work measurement' analysis to determine the time…
A: The total working hours of worker in 50 days is,128, 119, 95, 97, 124, 128, 142, 98, 108, 120, 113,…
Q: Identify whether the information provided is qualitative or quantitative data. UF NF Retentate…
A: Solution: 1.Qualitative Data: If the data is collected according to the well defined qualitative…
Q: In Exercises 37–42, find ||v|| and find the unit vector in the direction of v. 37. v = (3, –4) 38. v…
A: 37). Given vector is v=3,-4. To find v and find the unit vector in the direction of v. Solution: We…
Q: Question 2 Smoking and Birth Status Again Full-Term PreMature Row Summary Non-Smoker (N) 4036 365…
A:
Q: 13. According to the question 12, what is the strength of the relationship between the age and the…
A: Given: The provided data is: Less than 40 More than 40 Row total Support: For 145 78 223…
Q: Household Income ($1000s) $0- 24.9 $25 - 49.9 $50 - 74.9 $75-99.9 Education Level $100+ Total Not…
A: Since you have posted a question with multiple sub-parts, we will solve first three sub-parts for…
Q: Which of the following statements correctly describe estimation? a. It is the process of…
A: Given that, ESTIMATION: The answer is OPTION B. It is the process of inferring the values of…
Q: Day 1 Day 2 Day 3 Day 4 Day 5 Day 6 Day 7 Average 31 35.5 31 40.5 34 39 37.5 time for Total process…
A: Let X: Average time for moulding. Y: Average time for total process.
Q: 9.4 Data consistent with summary quantities in the article referenced in the previous exercise on…
A: The given data is calorie intake for children when they do not consume fast food and when consumed…
Q: 3. It was known that a toxic material was dumped in a river leading into a large salt water…
A: For the given data Perform Anova single factor
Q: Doctors are interested in the relationship between the dosage of a medicine and the ime required for…
A: Data is given for 10 patients : Linear regression =? R^2=? F test of goodness of fit at 5%…
Q: 2. ABM 11 students believe on the value of thriftiness. That is why they conducted a research on…
A: Since you have asked multiple questions, we will solve the first question for you. If you want any…
Q: 2. The table below shows the costs of photocopying spent by 125 students per week. cost 20-39 40-59…
A:
Q: Education Level Not H.S. Graduate $0 - 24.9 $25 - 49.9 $50 - 74.9 $75 - 99.9 $100+ Total 4,207 3,459…
A: Hey, since there are multiple subparts posted, we will answer the first three subparts. If you want…
Q: 2. The article presents an assessment of the health outcomes of people working in an environment…
A: The question is about categorical data analysis using chi square test Given :
Q: Day 1 Day 2 Day 3 Day 4 Day 5 Day 6 Day 7 Average 31 35.5 31 40.5 34 39 37.5 time for Total process…
A: Correlation The correlation is a statistical technique that is used for analyzing the behavior and…
Q: Let's examine labor force participation in October 2019, July 2020, and October 2020 Household…
A: Labor Force Participation rate: It is the percentage of the population that is either working or…
Q: onomic growth of Pakistan. He wanted to analyze data of Pakistan since its independence till date…
A: It is an important part of statistics. It is widely used.
Q: 10-32. An article in Technometrics (1999, Vol. 41, pp. 202-211) studied the capability of a gauge by…
A: a) Let X: weights of a paper sheet 1 Y: Weights of a paper sheet 2. Using shapiro.test we can test…
Q: 2.1 Display Data 84. Table 2.63 contains the 2010 obesity rates in U.S. states and Washington, DC.…
A: Given : Alabama 32.2 Kentucky 31.3 North Dakota 27.2 Alaska 24.5 Louisiana 31.0 Ohio 29.2 Arizona…
Q: The age-specific death rate for the over-65 age group is Age-Group Population Number of Deaths 65…
A: Formula for Age-specific death rate: Age specific death rate=Number of deaths in particular…
Q: To understand better the effects of exercise ang aging on various circulatory functions, the article…
A: The given data is 12.81, 14.95, 15.83, 15.97, 17.9, 18.27, 18.34, 19.82, 19.94, 20.62, 20.88, 20.93,…
Q: 10.51 Ground or Air? The earth's tempera W (which affects seed germination, crop survival in bad…
A: Given Sample size n. = 5 Confidence interval = 95 %. = 0.95 Significance level alpha = 5% = 0.05
Q: Table 1: Gender * Duration of time in Malaysia (years) Less than 1-2 5 years or Gender 3-4 years…
A: The data is present in the rows and column format, where rows represent the gender of the students…
Q: Population of cities and driving times are related, as shown in the accompanying table, which shows…
A: The power model is given as T = 3.40 × N0.18, where T is the Driving time and N is the population…
Q: 1) You test a new drug to reduce blood pressure. A group of 15 patients with high blood pressure…
A: Hello. Since your question has multiple sub-parts, we will solve first three sub-parts for you. If…
Q: Table 4 - Prevalence of Health Insurance for | and 2 Prevalence Have Health Insurance Population…
A: Part 1: We are given: The number of persons having Health Insurance in the population, X…
Q: 1) You test a new drug to reduce blood pressure. A group of 15 patients with high blood pressure…
A: Given Data: d¯=1.067s=1.7915 degree of freedom=n-1=15-1=14
Q: Engro group, who recently sold its Engro foods start-up for a multi-million-rupees sum, is looking…
A: K-mean clustering: K-mean clustering is an exploratory data analysis technique, it is done by…
Q: Still having trouble? Buy our HISET Study Guide Question 7 of 15 Lemons 35% Sugar Cups Stand…
A: Given problem:-
Q: Sonya collected data on the shoe size worn by each member of her class. She sees that John wears a…
A: Primary data: Primary data are those which are collected by the investigator ( or on his behalf) for…
Q: 4. Rapid hamster growing population has been posing an issue to Hamsterville. It just takes a few…
A: (a) i) From the given information, the required details are tabulated below, Year (t) Population…
Q: Q. No. 3. To the Board of Revenue , the deductions depends on the taxpayer’s adjusted gross income.…
A: Since we only answer up to 3 sub-parts, we’ll answer the first 3. Please resubmit the question and…
Q: Again recall Table 8a from the working paper "The Market for Financial Advisor Misconduct" discussed…
A: Let X be the random variable representing financial advisors who were disciplined for misconduct in…
Q: ou test a new drug to reduce blood pressure. A group of 15 patients with high blood pressure report…
A: Note: Since the answers for part (a) and part(b) is not given. We need to find the confidence…
Q: 6. From the data given below calculate the gross reproduction rate and net reproduction rate : Age…
A:
Please assist with the questions attached.

Step by step
Solved in 2 steps


- Suppose that 3000 drivers in Wakanda were randomly breath-tested on 21 April 2019 and 116 were above the limit of 0.05 blood- alcohol level. On 15 May 2019, 4000 drivers were tested and 98 were above this level. 1.3.1 What additional information would you require before trying to draw conclusion from these data? (5) 1.3.2 What factors, other than a real change in driver behaviours, could cause such a drop in the proportion of above-the-limit drivers. (6) 1.4 A set of data has an interquartile range of 20 and a lower quartile of 6. If the data is symmetrical, calculate the value of the median.Recent publications have addressed the growing concern in the scientific community around the increased prevalence of CAT scans in children between the ages of 7-18 and the growing rate of childhood cancers. Suppose the researcher plans to gather a SRS from a group of children in this age range who have received one or more CAT scans, and a SRS from a group of children who have never received a CAT scan and compare the number of cases of childhood cancers that develop over a prolonged period of time. Assume the following table summarizes the descriptive statistics for his samples. Population Average cases of childhood cancers Standard deviaton Sample size >CAT scan 24.6 2.4 1,894 No CAT scans 11.4 1.9 2,745 A) Carry out the appropriate statistical test to answer the researcher’s hypothesis regarding the difference in average cases of childhood cancers in children aged 7-18 receiving one or more CAT scans versus those that have never received a CAT scan. Use an alpha level…please answer 1 & 2 The National Highway Safety Administration recognizes that the antilock braking system as a revolutionary safety feature. The claim is that automobiles with this system are involved in fewer fatal crashes than those without. State the null and the alternative hypothesis to test this claim. An economist believes that there is a positive correlation between income and percent of disposable income saved by young adults. To test this, a sample of income and saving data is gathered from the Division of Taxation for adults under the age of 35. State the null and the alternative hypothesis to test this claim.
- 1.Based on these sample data, is there a statistically significant relationship (at the .05 level) between whether one enters the hospital with lung cancer (vs. something else) and the number of cigarettes one smokes? What justifies this conclusion?A cellphone provider has the business objective of wanting to determine the proportion of subscribers who would upgrade to a new cellphone with improved features if it were made available at a substantially reduced cost. Data are collected from a random sample of 600 subscribers. The results indicate that 131 of the subscribers would upgrade to a new cellphone at a reduced cost. Reducing the price will be profitable if at least 20% of the subscribers would upgrade. Complete parts (a) and (b) below. Question content area bottom Part 1 a. At the 0.01 level of significance, is there evidence that more than 20% of the customers would upgrade to a new cellphone at a reduced cost? Determine the null hypothesis, H0, and the alternative hypothesis, H1. A. H0: π=0.20 H1: π≠0.20 B. H0: π≥0.20 H1: π<0.20 C. H0: π≤0.20 H1: π>0.20 D. H0: π≠0.20 H1: π=thank you for your effort: 4- Does advertising by its three largest rivals affect sales of Bright Side detergent in a statistically significant way? Explain, using the appropriate p-value. 5- What fraction of the total variation in sales of Bright Side remains unexplained? What can the marketing director do to increase the explanatory power of the sales equation? What other explanatory variables might be added to this equation? 6- What is the expected level of sales each week when Vanguard spends $40,000 per week and the combined advertising expenditures for the three rivals are $100,000 per week?
- Suppose a researcher believes that the occurrence of natural disasters such as earthquakes leads to increased activity in the construction industry. he decides to collect province-level data on employment in the construction industry of an earthquake-prone country, like Japan, and regress this variable on an indicator variable that equals 1 if an earthquake took place in that province in the last five years. a. Should the researcher include province fixed effects in order to control for location specific characteristics of the labor market? b. What can the researcher to control for the location effects?A cellphone provider has the business objective of wanting to determine the proportion of subscribers who would upgrade to a new cellphone with improved features if it were made available at a substantially reduced cost. Data are collected from a random sample of 500 subscribers. The results indicate that 124 of the subscribers would upgrade to a new cellphone at a reduced cost. Reducing the price will be profitable if at least 20% of the subscribers would upgrade. Complete parts (a) and (b) below. Question content area bottom Part 1 a. At the 0.05 level of significance, is there evidence that more than 20% of the customers would upgrade to a new cellphone at a reduced cost? Determine the null hypothesis, H0, and the alternative hypothesis, H1. A. H0: π≥0.20 H1: π<0.20 B. H0: π≠0.20 H1: π=0.20 C. H0: π≤0.20 H1: π>0.20 D. H0: π=0.20 H1: π≠0.20 What is the test statistic? ZSTAT=enter your response…Suppose we take a sample of 2,500 blood donors from a population for which 50% (0.5) have type O+ blood. (a) Into what range of possible values should the sample proportion fall 95% of the time, according to the Empirical Rule? to (b) If the sample included only 625 donors instead of 2,500, would the range of possible sample proportions be wider, more narrow, or the same as with a sample of 2,500 donors? Explain your answer, and explain why it makes intuitive sense. The range would be with 625 donors compared to a sample of 2,500 donors since the standard deviation of the sampling distribution would be . This makes intuitive sense because if fewer donors are included in the sample, the proportion will be reliable as an estimate of the proportion.
- State the method of collecting of engineering data based on the given situation:(i) To investigate the effect of chemical in tyres on employee in car services centre, Nurse Health Institute has use employee health and employment records over the past two or three decades as a source of data.(ii) National Semiconductor company is able to identify ways to reduce defects and increase yield by analyzing and understanding the factors that drive performance such as identifying product sensitivities and the root cause of manufacturing inefficiencies.In an attempt to determine necessary dosages of a new drug (HDL) used to control sepsis, assume you administer varying amounts of HDL to 40 mice. You create four groups and label them low dosage, moderate dosage, large dosage and very large dosage. The dosages also vary within each group. After the mice are injected with the HDL and the sepsis bacteria, the time until the onset of sepsis is recorded. Your job as a statistician is to effectively communicate the results of the study. 1. Which measures of position could be used to help describe the data results? 2. If 40% of the mice in the top quartile survived after the injection, how many mice would that be? 3. What information can be given from using percentiles? 4. What information can be given using quartiles? 5. What information can be given from using standard scores?In an attempt to determine necessary dosages of a new drug (HDL) used to control sepsis, assume you administer varying amounts of HDL to 40 mice. You create four groups and label them low dosage, moderate dosage, large dosage and very large dosage. The dosages also vary within each group. After the mice are injected with the HDL and the sepsis bacteria, the time until the onset of sepsis is recorded. Your job as a statistician is to effectively communicate the results of the study. 1. Which measures of position could be used to help describe the data results? 2. If 40% of the mice in the top quartile survived after the injection, how many mice would that be?