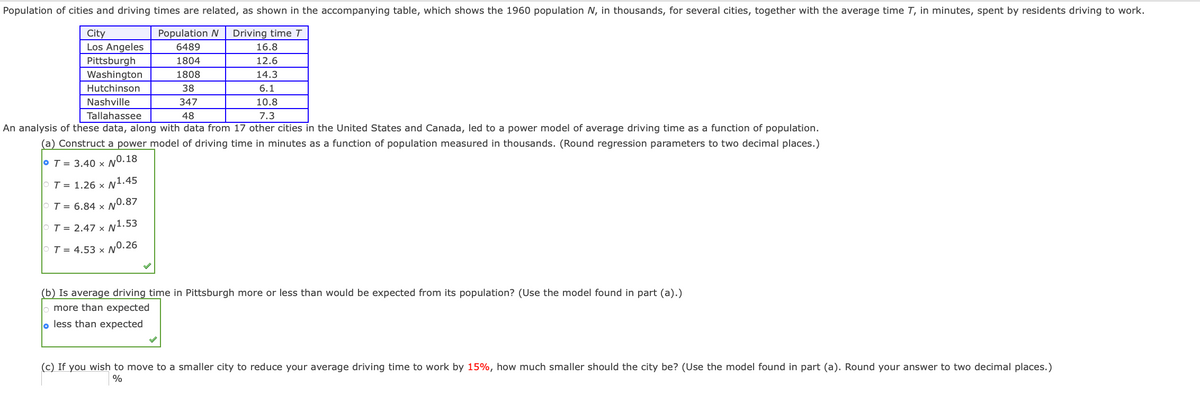
Population of cities and driving times are related, as shown in the accompanying table, which shows the 1960 population N, in thousands, for several cities, together with the average time T, in minutes, spent by residents driving to work. City Los Angeles Pittsburgh Washington Population N Driving time T 16.8 6489 1804 12.6 1808 14.3 Hutchinson 38 6.1 Nashville 347 10.8 Tallahassee 48 7.3 An analysis of these data, along with data from 17 other cities in the United States and Canada, led to a power model of average driving time as a function of population. (a) Construct a power model of driving time in minutes as a function of population measured in thousands. (Round regression parameters to two decimal places.) T = 3,40 x N0.18 T= 1.26 x N1.45 T= 6.84 x N0.87 T= 2.47 x N1.53 T= 4.53 x N0.26 (b) Is average driving time in Pittsburgh more or less than would be expected from its population? (Use the model found in part (a).) more than expected o less than expected (c) If you wish to move to a smaller city to reduce your average driving time to work by 15%, how much smaller should the city be? (Use the model found in part (a). Round your answer to two decimal places.)


Unitary Method
The word “unitary” comes from the word “unit”, which means a single and complete entity. In this method, we find the value of a unit product from the given number of products, and then we solve for the other number of products.
Speed, Time, and Distance
Imagine you and 3 of your friends are planning to go to the playground at 6 in the evening. Your house is one mile away from the playground and one of your friends named Jim must start at 5 pm to reach the playground by walk. The other two friends are 3 miles away.
Profit and Loss
The amount earned or lost on the sale of one or more items is referred to as the profit or loss on that item.
Units and Measurements
Measurements and comparisons are the foundation of science and engineering. We, therefore, need rules that tell us how things are measured and compared. For these measurements and comparisons, we perform certain experiments, and we will need the experiments to set up the devices.


Trending now
This is a popular solution!

Step by step
Solved in 2 steps


