35. The table below shows historical data for the distribution of the number of customers, in half-hour time periods, who visit the electronics department of a retail store. For example, in 25 percent of the time periods for which data were collected, no customers were observed in the electronics department of the store. Number of customers 1 3 or more Proportion of time periods 0.25 0.20 0.30 0.25 To investigate if the distribution has changed, the number of customers who visited the electronics department of the store was recorded for each of 50 randomly selected time periods. The results are shown in the table below. Number of customers 1 2 3 or more Number of time periods 4 13 14 19
35. The table below shows historical data for the distribution of the number of customers, in half-hour time periods, who visit the electronics department of a retail store. For example, in 25 percent of the time periods for which data were collected, no customers were observed in the electronics department of the store. Number of customers 1 3 or more Proportion of time periods 0.25 0.20 0.30 0.25 To investigate if the distribution has changed, the number of customers who visited the electronics department of the store was recorded for each of 50 randomly selected time periods. The results are shown in the table below. Number of customers 1 2 3 or more Number of time periods 4 13 14 19

Glencoe Algebra 1, Student Edition, 9780079039897, 0079039898, 2018
18th Edition
ISBN:9780079039897
Author:Carter
Publisher:Carter
Chapter10: Statistics
Section10.6: Summarizing Categorical Data
Problem 23PPS

Related questions

Question
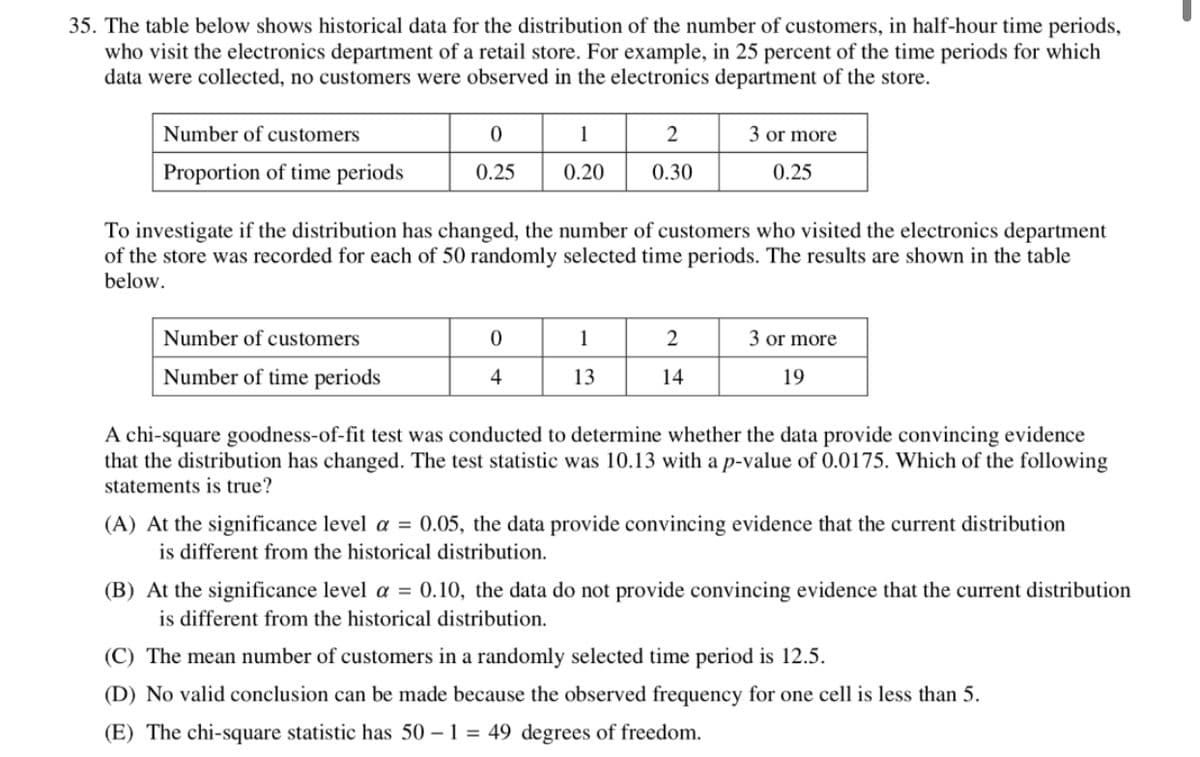
Transcribed Image Text:35. The table below shows historical data for the distribution of the number of customers, in half-hour time periods,
who visit the electronics department of a retail store. For example, in 25 percent of the time periods for which
data were collected, no customers were observed in the electronics department of the store.
Number of customers
1
3 or more
Proportion of time periods
0.25
0.20
0.30
0.25
To investigate if the distribution has changed, the number of customers who visited the electronics department
of the store was recorded for each of 50 randomly selected time periods. The results are shown in the table
below.
Number of customers
1
2
3 or more
Number of time periods
4
13
14
19
A chi-square goodness-of-fit test was conducted to determine whether the data provide convincing evidence
that the distribution has changed. The test statistic was 10.13 with a p-value of 0.0175. Which of the following
statements is true?
(A) At the significance level a = 0.05, the data provide convincing evidence that the current distribution
is different from the historical distribution.
(B) At the significance level a = 0.10, the data do not provide convincing evidence that the current distribution
is different from the historical distribution.
(C) The mean number of customers in a randomly selected time period is 12.5.
(D) No valid conclusion can be made because the observed frequency for one cell is less than 5.
(E) The chi-square statistic has 50 – 1 = 49 degrees of freedom.
Expert Solution
This question has been solved!
Explore an expertly crafted, step-by-step solution for a thorough understanding of key concepts.

This is a popular solution!

Trending now
This is a popular solution!

Step by step
Solved in 2 steps

Knowledge Booster


Learn more about
Need a deep-dive on the concept behind this application? Look no further. Learn more about this topic, statistics and related others by exploring similar questions and additional content below.Recommended textbooks for you
Glencoe Algebra 1, Student Edition, 9780079039897…
Algebra
ISBN:
9780079039897
Author:
Carter
Publisher:
McGraw Hill
Glencoe Algebra 1, Student Edition, 9780079039897…
Algebra
ISBN:
9780079039897
Author:
Carter
Publisher:
McGraw Hill