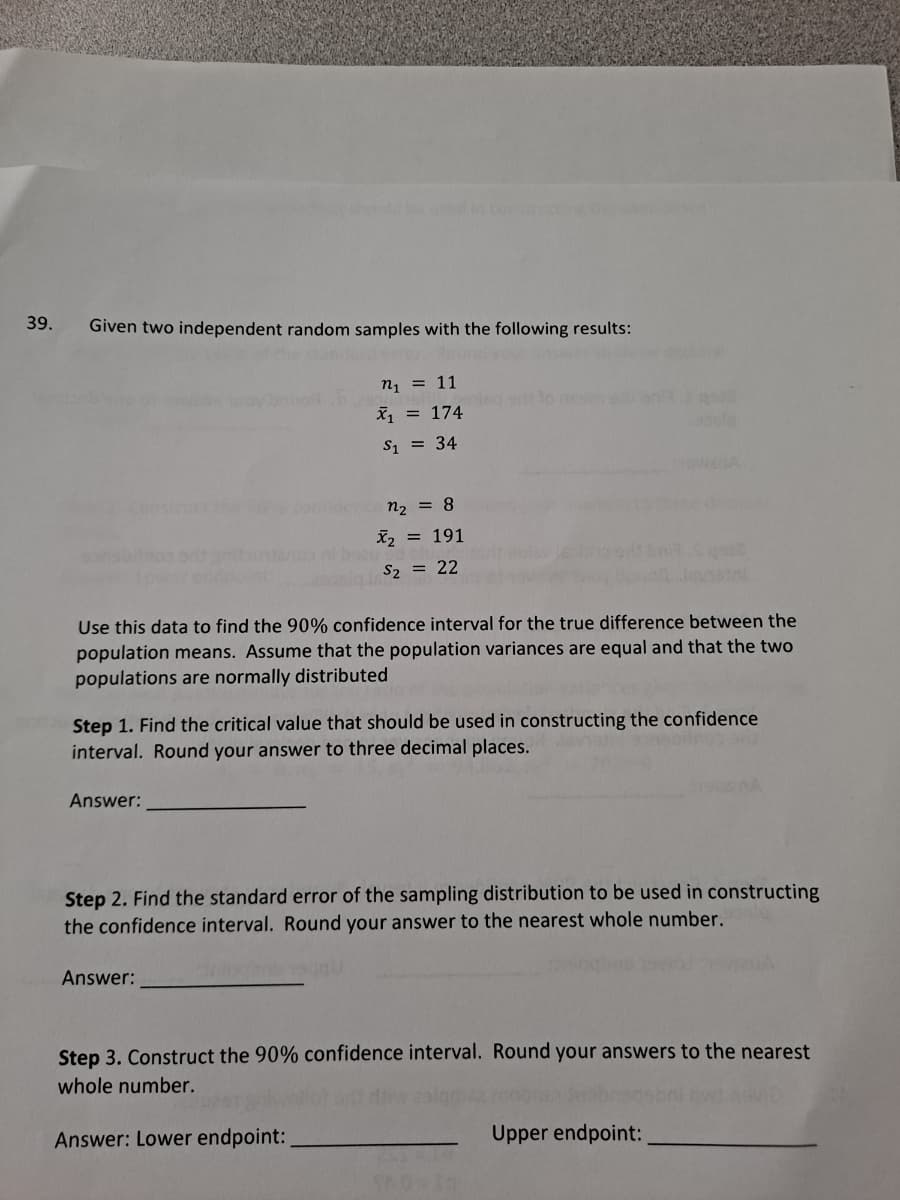
39. Given two independent random samples with the following results: n1 = 11 X, = 174 S1 = 34 n2 = 8 X2 = = 191 S2 = 22 Use this data to find the 90% confidence interval for the true difference between the population means. Assume that the population variances are equal and that the two populations are normally distributed Step 1. Find the critical value that should be used in constructing the confidence interval. Round your answer to three decimal places. Answer: Step 2. Find the standard error of the sampling distribution to be used in constructing the confidence interval. Round your answer to the nearest whole number. Answer: Step 3. Construct the 90% confidence interval. Round your answers to the nearest whole number. Answer: Lower endpoint: Upper endpoint:

MATLAB: An Introduction with Applications
6th Edition
ISBN:9781119256830
Author:Amos Gilat
Publisher:Amos Gilat
Chapter1: Starting With Matlab
Section: Chapter Questions
Problem 1P
icon
Related questions
icon
Concept explainers
Topic Video
Question
#39
39.
Given two independent random samples with the following results:
n1 = 11
X = 174
S1 = 34
n2 = 8
X, = 191
S2 = 22
Use this data to find the 90% confidence interval for the true difference between the
population means. Assume that the population variances are equal and that the two
populations are normally distributed
Step 1. Find the critical value that should be used in constructing the confidence
interval. Round your answer to three decimal places.
Answer:
Step 2. Find the standard error of the sampling distribution to be used in constructing
the confidence interval. Round your answer to the nearest whole number.
Answer:
Step 3. Construct the 90% confidence interval. Round your answers to the nearest
whole number.
Answer: Lower endpoint:
Upper endpoint:
Transcribed Image Text:39. Given two independent random samples with the following results: n1 = 11 X = 174 S1 = 34 n2 = 8 X, = 191 S2 = 22 Use this data to find the 90% confidence interval for the true difference between the population means. Assume that the population variances are equal and that the two populations are normally distributed Step 1. Find the critical value that should be used in constructing the confidence interval. Round your answer to three decimal places. Answer: Step 2. Find the standard error of the sampling distribution to be used in constructing the confidence interval. Round your answer to the nearest whole number. Answer: Step 3. Construct the 90% confidence interval. Round your answers to the nearest whole number. Answer: Lower endpoint: Upper endpoint:
Expert Solution
steps

Step by step

Solved in 4 steps with 17 images

Blurred answer
Knowledge Booster
Application of Algebra
Learn more about
Need a deep-dive on the concept behind this application? Look no further. Learn more about this topic, statistics and related others by exploring similar questions and additional content below.
Recommended textbooks for you
MATLAB: An Introduction with Applications
Statistics
ISBN:
9781119256830
Author:
Amos Gilat
Publisher:
John Wiley & Sons Inc
Probability and Statistics for Engineering and th…
Statistics
ISBN:
9781305251809
Author:
Jay L. Devore
Publisher:
Cengage Learning
Statistics for The Behavioral Sciences (MindTap C…
Statistics
ISBN:
9781305504912
Author:
Frederick J Gravetter, Larry B. Wallnau
Publisher:
Cengage Learning
Elementary Statistics: Picturing the World (7th E…
Statistics
ISBN:
9780134683416
Author:
Ron Larson, Betsy Farber
Publisher:
PEARSON
The Basic Practice of Statistics
Statistics
ISBN:
9781319042578
Author:
David S. Moore, William I. Notz, Michael A. Fligner
Publisher:
W. H. Freeman
Introduction to the Practice of Statistics
Statistics
ISBN:
9781319013387
Author:
David S. Moore, George P. McCabe, Bruce A. Craig
Publisher:
W. H. Freeman