4. In Student's t-distribution, what is the nd mom А. 5 В. 24 С. 25 D. 26

Glencoe Algebra 1, Student Edition, 9780079039897, 0079039898, 2018
18th Edition
ISBN:9780079039897
Author:Carter
Publisher:Carter
Chapter10: Statistics
Section10.4: Distributions Of Data
Problem 19PFA

Related questions
Question
Solve for numbers 4 and 5
Transcribed Image Text:t-distribution
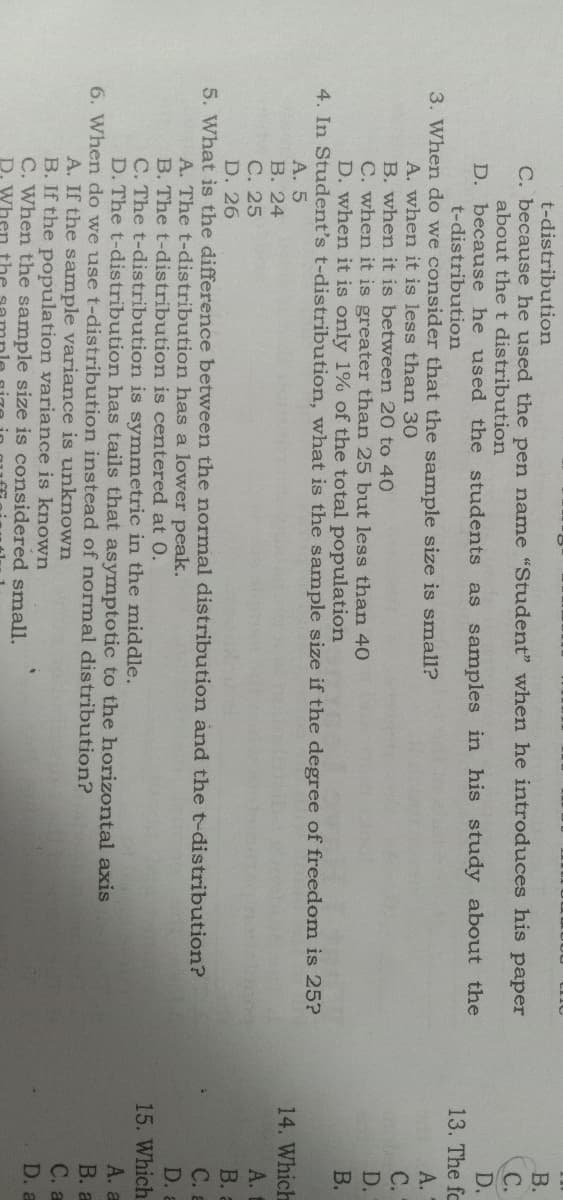
C. because he used the pen name "Student" when he introduces his paper
about the t distribution
B.
C.
D.
D. because he used the students as samples in his study about the
t-distribution
13. The fc
3. When do we consider that the sample size is small?
А.
A. when it is less than 30
B. when it is between 20 to 40
C. when it is greater than 25 but less than 40
D. when it is only 1% of the total population
C.
D.
B.
4. In Student's t-distribution, what is the sample size if the degree of freedom is 25?
А. 5
В. 24
С. 25
14. Which
A.
D. 26
В.
5. What is the difference between the normal distribution and the t-distribution?
C. a
A. The t-distribution has a lower peak.
B. The t-distribution is centered at 0.
C. The t-distribution is symmetric in the middle.
D. The t-distribution has tails that asymptotic to the horizontal axis
D. a
15. Which
А. a
6. When do we use t-distribution instead of normal distribution?
A. If the sample variance is unknown
B. If the population variance is known
C. When the sample size is considered small.
D. Wh
В. а
C. a
D. a
Expert Solution
This question has been solved!
Explore an expertly crafted, step-by-step solution for a thorough understanding of key concepts.

Step by step
Solved in 2 steps

Recommended textbooks for you
Glencoe Algebra 1, Student Edition, 9780079039897…
Algebra
ISBN:
9780079039897
Author:
Carter
Publisher:
McGraw Hill
Glencoe Algebra 1, Student Edition, 9780079039897…
Algebra
ISBN:
9780079039897
Author:
Carter
Publisher:
McGraw Hill