4. Make a graph the frequency distribution of the sample variances. 5. Compute the mean of the sample variances and compare to the population variance.
4. Make a graph the frequency distribution of the sample variances. 5. Compute the mean of the sample variances and compare to the population variance.

Chapter8: Sequences, Series,and Probability
Section8.7: Probability
Problem 11ECP: A manufacturer has determined that a machine averages one faulty unit for every 500 it produces....

Related questions
Question
4. Make a graph the frequency distribution of the sample variances.
5. Compute the mean of the sample variances and compare to the population variance.
Transcribed Image Text:SAMPLE
SAMPLE
TRIAL
SAMPLES
MEAN
VARIANCE
1
7
8
10
7.2
9.7
2
1
6
7
13
6.4
18.8
3
2
4
10
6.2
11.2
4
4
6
7
10
11
7.6
8.3
5
7
12
13
7.8
21.7
3
10
12
13
16.5
7
1
4
7
12
5.8
16.7
8
3
5
7
10
13
7.6
15.8
9
1
5.
6
11
13
7.2
23.2
10
3
8
13
6.2
19.7
11
3
7
10
12
7.4
13.3
12
1
2
7
8
11
5.8
17.7
13
2
10
6.4
9.3
14
1
3
4
11
4.8
14.2
15
1
6
8
11
13
7.8
21.7
16
2
4
7
12
6.8
15.7
17
1
5.
11
12
13
8.4
26.8
18
2
5
6.
7
8
5.6
5.3
19
1
2
12
13
7.2
30.7
20
1
5
6
7
11
6
13
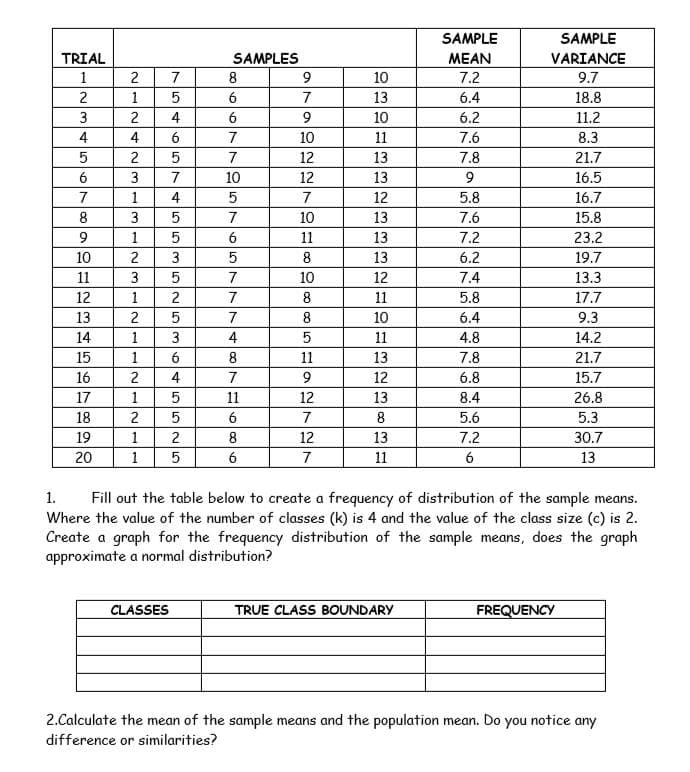
1.
Fill out the table below to create a frequency of distribution of the sample means.
Where the value of the number of classes (k) is 4 and the value of the class size (c) is 2.
Create a graph for the frequency distribution of the sample means, does the graph
approximate a normal distribution?
CLASSES
TRUE CLASS BOUNDARY
FREQUENCY
2.Calculate the mean of the sample means and the population mean. Do you notice any
difference or similarities?
Expert Solution
This question has been solved!
Explore an expertly crafted, step-by-step solution for a thorough understanding of key concepts.

Step by step
Solved in 3 steps with 1 images

Recommended textbooks for you

Holt Mcdougal Larson Pre-algebra: Student Edition…
Algebra
ISBN:
9780547587776
Author:
HOLT MCDOUGAL
Publisher:
HOLT MCDOUGAL
Holt Mcdougal Larson Pre-algebra: Student Edition…
Algebra
ISBN:
9780547587776
Author:
HOLT MCDOUGAL
Publisher:
HOLT MCDOUGAL