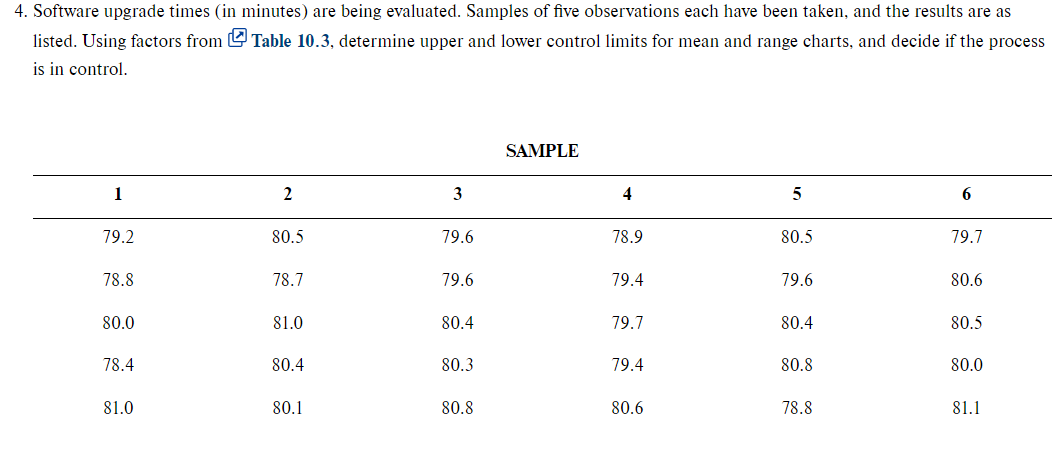
4. Software upgrade times (in minutes) are being evaluated. Samples of five observations each have been taken, and the results are as listed. Using factors from Table 10.3, determine upper and lower control limits for mean and range charts, and decide if the process is in control. SAMPLE 1 2 5 6 79.2 80.5 80.5 79.7 78.8 78.7 79.6 80.6 80.0 81.0 80.4 80.5 78.4 80.4 80.8 80.0 81.0 80.1 78.8 81.1 3 79.6 79.6 80.4 80.3 80.8 4 78.9 79.4 79.7 79.4 80.6
4. Software upgrade times (in minutes) are being evaluated. Samples of five observations each have been taken, and the results are as listed. Using factors from Table 10.3, determine upper and lower control limits for mean and range charts, and decide if the process is in control. SAMPLE 1 2 5 6 79.2 80.5 80.5 79.7 78.8 78.7 79.6 80.6 80.0 81.0 80.4 80.5 78.4 80.4 80.8 80.0 81.0 80.1 78.8 81.1 3 79.6 79.6 80.4 80.3 80.8 4 78.9 79.4 79.7 79.4 80.6

Glencoe Algebra 1, Student Edition, 9780079039897, 0079039898, 2018
18th Edition
ISBN:9780079039897
Author:Carter
Publisher:Carter
Chapter10: Statistics
Section10.4: Distributions Of Data
Problem 19PFA

Related questions
Question
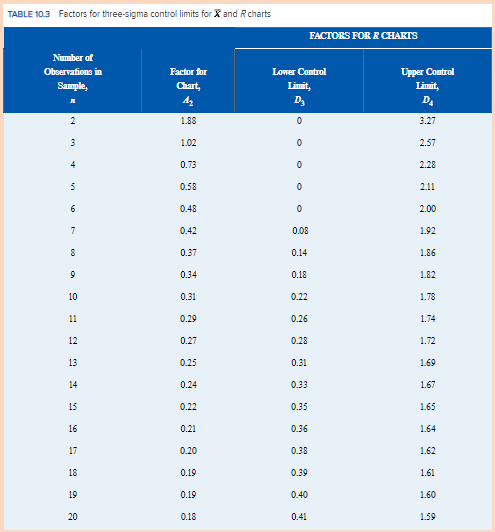
Transcribed Image Text:TABLE 10.3 Factors for three-sigma control limits for X and R charts
Number of
Observations in
Factor for
Sample,
Chart,
A₂
R
2
1.88
3
1.02
4
0.73
0.58
0.48
0.42
0.37
0.34
0.31
0.29
0.27
0.25
0.24
0.22
0.21
0.20
0.19
0.19
0.18
5
6
7
8
9
10
11
12
13
14
15
16
17
18
19
20
FACTORS FOR R CHARTS
Lower Control
Linit,
D₂
0
0
0
0
0
0.08
0.14
0.18
0.22
0.26
0.28
0.31
0.33
0.35
0.36
0.38
0.39
0.40
0.41
Upper Control
Limit,
D₂
3.27
2.57
2.28
2.11
2.00
1.92
1.86
1.82
1.78
1.74
1.72
1.69
1.67
1.65
1.64
1.62
1.61
1.60
1.59
Transcribed Image Text:4. Software upgrade times (in minutes) are being evaluated. Samples of five observations each have been taken, and the results are as
Table 10.3, determine upper and lower control limits for mean and range charts, and decide if the process
listed. Using factors from
is in control.
SAMPLE
1
2
5
6
79.2
80.5
80.5
79.7
78.8
78.7
79.6
80.6
80.0
81.0
80.4
80.5
78.4
80.4
80.8
80.0
81.0
80.1
78.8
81.1
3
79.6
79.6
80.4
80.3
80.8
4
78.9
79.4
79.7
79.4
80.6
Expert Solution
This question has been solved!
Explore an expertly crafted, step-by-step solution for a thorough understanding of key concepts.

This is a popular solution!

Trending now
This is a popular solution!

Step by step
Solved in 4 steps with 2 images

Recommended textbooks for you
Glencoe Algebra 1, Student Edition, 9780079039897…
Algebra
ISBN:
9780079039897
Author:
Carter
Publisher:
McGraw Hill
Glencoe Algebra 1, Student Edition, 9780079039897…
Algebra
ISBN:
9780079039897
Author:
Carter
Publisher:
McGraw Hill