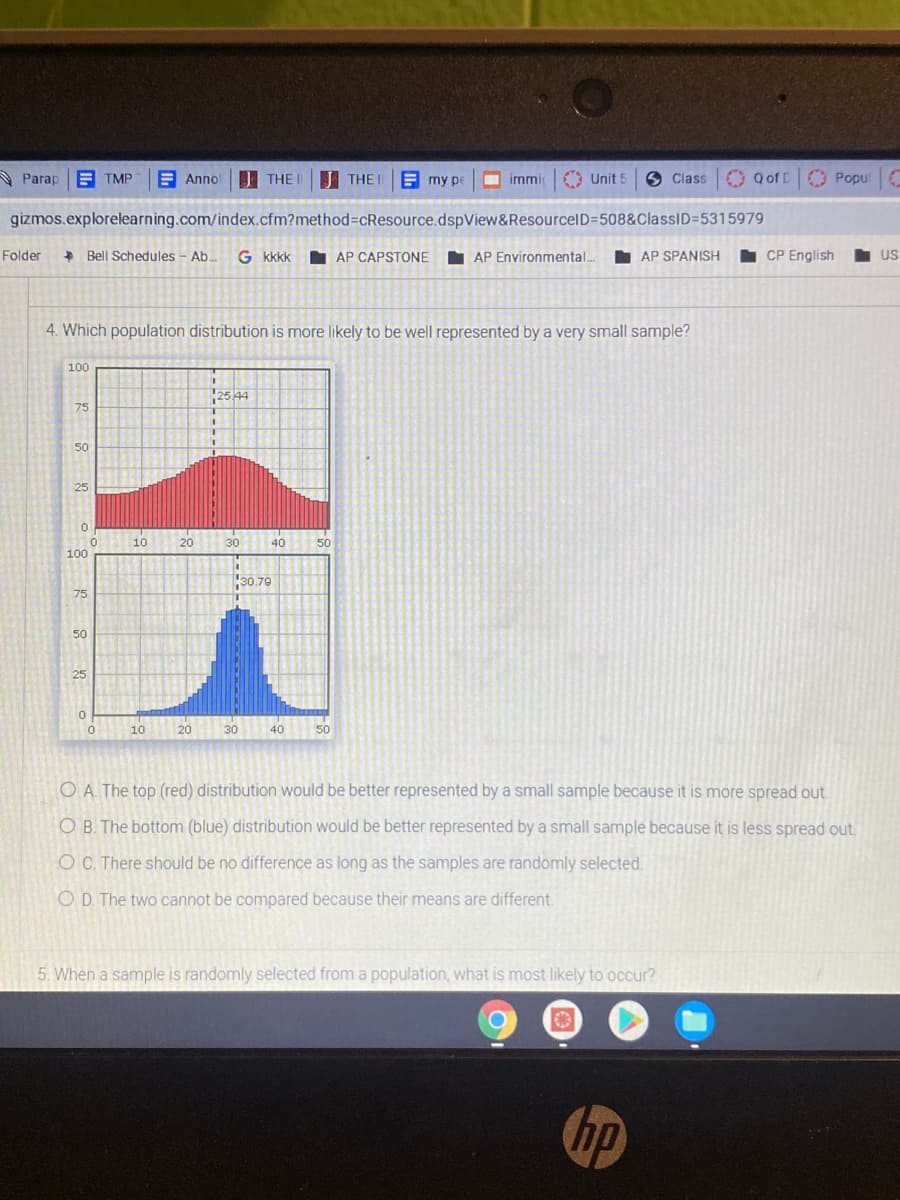
4. Which population distribution is more likely to be well represented by a very small sample? 100 25 44 75 50 25 10 20 30 40 50 100 30.79 75 50 25 10 20 30 40 50 O A The top (red) distribution would be better represented by a small sample because it is more spread out. O B. The bottom (blue) distribution would be better represented by a small sample because it is less spread out OC. There should be no difference as long as the samples are randomly selected. O D. The two cannot be compared because their means are different.
Q: From the adult male population of four large cities, random sample of sizes given below were taken…
A: Solution is given:
Q: The test scores of 5 students are under consideration. The following is the dotplot for the sampling…
A: We have to find out answer
Q: 14. Compute the weighted averages of the six(6) CPA examinees below up to two(2) decimal places? Who…
A: Given, Subjects Amy Ben Coy Dan Emy Fam 1 (1 unit) 60 70 60 95 75 95 2 (1 unit) 80 70 80 95…
Q: The price of a share of stock divided by the company's estimated future earnings per share is called…
A: Note: Hey, since there are multiple subparts posted, we will answer first three subparts. If you…
Q: A simple random sample of 8 employees of a corporation provided the following information. Employee…
A: A simple random sample of 8 employees of a corporation provided the given Information. The objective…
Q: Suppose that a researcher selects a sample of participants from a population. If the shape of the…
A: For the given statement Select the correct choice ?
Q: A professor states papers are graded using the following categories: excellent, above average,…
A: Given information: Level of significanceα=0.05. Sample size(n)=100. Categories Observed…
Q: Suppose the age distribution in a city is as follows. Under 18 26% 18–25 16% 26–50 32% 51–65 8%…
A: We have to find no. Of people from each sample required.
Q: In a business, the Chief Executive Officer wants to know if his workers are for or against mandatory…
A: Given that In a business, the Chief Executive Officer wants to know if his workers are for or…
Q: 18. You want to see if there is any association between someone's years of education and salary at…
A: Given: Years of Education Starting Salary (in thousand) 11 33 15 40 14 22 18 38 16 60…
Q: What is the correct H0?
A:
Q: what is the critical value and z value ?
A: Given the blood type distribution for the general population is as Blood type Percentage A 20…
Q: How many individuals had scores in the 70s? The following stem and leaf display shows a distribution…
A: The distribution of exam scores are given
Q: 4. In 2014, the University of Houston carried out a study for the Texas Lottery Commission. The…
A: The null and alternate hypothesis are H0 : p1=0.14, p2=0.2, p3=0.19, p4=0.18, p5=0.14, p6=0.15HA:…
Q: The following table lists the frequency distribution for a sample of students majors in DU. Find the…
A: From the given table, Total frequency=49+36+28+27=140 Number of groups 4
Q: The following contingency table records some information about a sample of visitors to Old Fort…
A: There are two categorical variables which are origin and group. We have to find the expected value…
Q: Consider the following sampling distribution of the sample mean. 4 4.5 5.5 P(x) 1 8 8. 12. What is…
A: Solution: Note: Hello! As you have posted more than 3 sub parts, we are answering the first 3…
Q: Assuming a bag of jelly beans consists of a random sample of that particular kind, does it provide…
A: The claim is the true distribution of colors is not what Sam claims.
Q: The following is the theoretical distribution of M & M's candy colors, according to the M&M/MARS…
A: a) The null and alternative hypothesis Ho :p1=0.30,p2=0.20,p3=0.20,p4=0.10, p5=0.10,p6= 0.10. Ha :…
Q: The Vice-President of ABC Bank feels that each savings account customer has, on average, four oredit…
A: From the widely accepted definition, Probability (occurring of an event E)=P(E) =Favorable…
Q: . Prior to graduation, a high school class was surveyed about their plans after high school. The…
A: Note: Hey, since there are multiple questions posted, we will answer first question. If you want any…
Q: 2) Given the table below, find the sample units per strata for a sample of 325 students Courses Year…
A: Given: Courses Year Level Number of students Male Female Biology First 20 46 Second 15…
Q: State the null and alternate hypothesis. Will you use a left tail, right tail or 2 tailed test?…
A: It is given that the researcher wants to test whether the sample distribution of fish in the lake…
Q: The following summary measures are from a random sample. n = 60 x̅ = 81.1 ∑x² = 412142 The sample…
A: The formula for the variance is given by s2=∑x2-∑x2nn-1 (1) since we know that x=∑xn…
Q: Consider the following. Sample A Sample B s2 30 32 n 25 20 We want to test the hypothesis that…
A: According to the given information in this question we need to calculate the test statistic We know…
Q: 15) If the population mean u of the data set is 2.09, what is the mean g of the sampling…
A:
Q: Suppose the age distribution in a city is as follows. Under 18 24% 18–25 18% 26–50 34% 51–65 10%…
A: n= 350 We can create a table for the given data.
Q: 7. The following frequency table shows the test score distribution for a random sample of 100…
A: As per given information: Class f Mid value (x) (f)(x) CF 0-2 3 1 9 3 2-4 7 3 21 10 4-6 15…
Q: . Consider three groups of employees who are exposed to three different methods of managing…
A: For Group A : XXA XA2 75 5625 80 6400 95 9025 80 6400 85 7225 Sum = 415 Sum = 34675…
Q: The instructor takes a random sample of size from the population data and obtains the following…
A: The random variable X follows normal distribution. A sample of 6 observations is given. We have to…
Q: #7) The Fish and Game Department in Wisconsin stocked a new lake with the following distribution of…
A:
Q: 29. The following table lists the distribution by degrees in psychology conferred by degreegranting…
A: Given,
Q: Conduct a goodness-of-fit test to determine if the actual college majors of graduating males fit the…
A:
Q: You want to see if there is any association between someone's years of education and salary at their…
A: Two variables are considered as linearly associated if the correlation coefficient is not 0. So a…
Q: 7.11 The following table represents the scores of students in Math- ematics in the 10th grade. The…
A: Given : Sample (n) = 20 Score of students in Mathematics in the 10th grade Scores 75 40 55…
Q: 2) A researcher is interesting in studying if male smokers and female smokers smoke a different…
A: a) Since, we have two samples and they are different from each other hence we shall do a two sample…
Q: Suppose the age distribution of the Canadian population and the age distribution of a random sample…
A: The age distribution of the Canadian population and the age distribution of a random sample of 559…
Q: (d) Construct a conditional distribution of immigration opinion by ethnicity. Ethnicity Non-Hispanic…
A: Given data is Opinion Non-Hispanic Whites Blacks Hispanics Good thing 185 152 144 Bad thing…
Q: A particular brand or dishwasner soap is sold in oz, and 70 oz. Twenty percent or purchasers select…
A: Given Information: The possible values of x are: 25, 30, 70 with probabilities 0.20, 0.50, 0.30…
Q: 4. A researcher conducts a study comparing two dif- ferent treatments with a sample of n = 16…
A: Given data for treatments isTreatment 1:-6,7,11,4,19,17,2,5,9,13,6,23,11,4,6,1Treatment…
Q: 18. You want to see if there is any association between someone's years of education and salary at…
A: To know the magnitude and direction of the association , we need to calculate the correlation…
Q: 4. The age and annual salary of a random sample of 20 University graduates in a town is shown below.…
A: Scatter plot: Scatter plot is the graphical display that shows the relationship between two…
Q: In a study investigating the time of coming to work late in an enterprise, the time of coming to…
A: The following data is given in the question n=300x¯=3Q1=1.2 Since data is large enough, we can…
Q: A firm wants to know if there is any difference in percentage of sport category watched based on…
A: Given data: Item Ages 18-34 Ages 35+ eSports 50.6 86.3 Mixed Martial Arts 30…
Q: The price of a share of stock divided by the company's estimated future earnings per share is called…
A: From given data, n=51 x=25.17 s=15.472
Q: 4) The following are the sample of scores of two batsmen X and Y in a series of innings. X 80 39 60…
A:
Q: The following is the theoretical distribution of M & M's candy colors, according to the M&M/MARS…
A: The null and alternative hypotheses are as follows: H0:p1=0.30,p2=0.20,p3=0.20,p4=0.10, p5=0.10,p6=…
Q: The type of household for the U.S. population and for a random sample of 411 households from a…
A: Given that Sample size =441 Significance level=0.05 We have to conduct Chi square test for…
Q: From the population of the 300 student scores above a random sample of size n = 8 is selected. The…
A: Since you have posted a question with multiple sub-parts, we will solve first three sub-parts for…
Q: QUESTION 3 The file contains the amount that a sample of nine customers spent for lunch ($) at a…
A:
Trending now
This is a popular solution!
Step by step
Solved in 2 steps
- Suppose your dependent variable is crime rates for various cities. To correct for heteroskedasticity you should Select one: a. multiply observations by the city size b. multiply observations by the square root of the city size c. none of these d. divide observations by the square root of the city size e. divide observations by the city sizeSuppose your dependent variable is aggregate household demand for electricity for various cities. To correct for heteroskedasticity you should Select one: a. multiply observations by the square root of the city size b. multiply observations by the city size c. divide observations by the city size d. divide observations by the square root of the city size e. none of theseA city's transportation committee has conducted research on traffic and car accidents for downtown streets. There is a 9% chance of being involved in a car accident when 15 or more cars are driving on Johnson Street and a 7.5% chance when 20 or more cars are driving on Dublin Street. The two streets intersect to form a risk area with a radius of 0.1 mi. Approximate the density of cars per square mile in the risk area when 17 cars are on Johnson Street and 21 cars are on Dublin Street. Use 3.14 for pi. There are approximately 1,210 cars per square mile in the risk area. There are approximately 2,674 cars per square mile in the risk area. There are approximately 2,165 cars per square mile in the risk area. There are approximately 1,082 cars per square mile in the risk area.
- One well-known bread store is franchising in Metro, they sell their bread depending on the taste of their bread which is creamy (c), salty (s), buttery (b). A first customer bought bread consisting of 2 creamy, 4 salty, and 3 buttery for Php 4810. The second customer bought 3 salty and 2 buttery for Php 2730. The last customer bought 1 creamy, 2 salty, and 1 buttery for Php 2210.Use LU Decomposition method (Doolittle’s method) to determine the price of each bread depending on their taste.A researcher collected data on how much extra sleep subjects got after being placed into one of two groups. Each group received a different set of mediation exercises. The dataset they collected is called df and the first 6 rows are shown here: Which lines of code are required to make the plot above? Click all that apply. a. geom_boxplot(alpha = .3) b. geom_jitter(width=.1, size = 2, color = "navy") c. geom_boxplot(fill = "dodgerblue", alpha = .3) d. geom_jitter(color = "navy") e. ggplot(sleep, aes(x = group, y = extra)) f. theme_classic()A research center claims that more than 29% of employees in a certain country have changed jobs in the past three years. In a random sample of 220 people from that country, 77 have changed jobs in the past three years. At alphaαequals=0.10, is there enough evidence to support the center's claim? Complete parts (a) through (e) below. (a) Identify the claim and state Upper H 0H0 and Upper H Subscript aHa. Identify the claim in this scenario. Select the correct choice below and fill in the answer box to complete your choice. (Type an integer or a decimal. Do not round.) A. At most nothing% of employees in the country have changed jobs in the past three years. B. More than nothing% of employees in the country have changed jobs in the past three years. C. The percentage of employees in the country who have changed jobs in the past three years is not nothing%. D. nothing% of employees in the country have changed jobs in the past three years.…
- A research center claims that more than 29% of employees in a certain country have changed jobs in the past three years. In a random sample of 220 people from that country, 77 have changed jobs in the past three years. At alphaαequals=0.10, is there enough evidence to support the center's claim? Complete parts (a) through (e) below. (a) Identify the claim and state Upper H 0H0 and Upper H Subscript aHa. Identify the claim in this scenario. Select the correct choice below and fill in the answer box to complete your choice. (Type an integer or a decimal. Do not round.) A. At most nothing% of employees in the country have changed jobs in the past three years. B. More than nothing% of employees in the country have changed jobs in the past three years. C. The percentage of employees in the country who have changed jobs in the past three years is not nothing%. D. nothing% of employees in the country have changed jobs in the past three years.…An ecologist is considering two different positions in which to setup his solar energy collector. He takes two identical collector places one in each of the positions and measure the energy in at collected as 10 consecutive days. Days 1 2 3 4 5 6 7 8 9 10 Position X 2.6 5.4 3.2 5.0 4.3 2.7 2.6 3.9 6.0 1.6 POSITION y 2.8 5.1 3.1 6.0 4.6 3.2 2.9 4.5 6.2 2.2 Test whether the difference of mean is significance ? what will be the answerCompute the sum of squares error (SSE) by hand for the given set of data and linear model: (6,6),(7,7),(8,9); Y = x - 1
- An industrial concern has experimented with several different mixtures of the fourcomponents—magnesium, sodium nitrate, strontium nitrate, and a binder—that comprise arocket propellant. The company has found that two mixtures, in particular, give higher flare illumination values than the others. Mixture 1 consists of a blend composed of the proportions.40, .10, .42, and .08, respectively, for the four components of the mixture; mixture 2 consists ofa blend using the proportions .60, .25, .10, and .05. Twenty different blends (10 of each mixture)are prepared and tested to obtain the flare-illumination values. These data appear here (in unitsof 1,000 candles).Mixture 1 185 192 201 215 170 190 175 172 198 202Mixture 2 221 210 215 202 204 196 225 230 214 217a. Plot the sample data. Which test(s) could be used to compare the meanillumination values for the two mixtures?b. Give the level of significance of the test and interpret your findingsThe spike stature of the plants grown from the seeds of the porcine separates (Dactylis glomerata L) collected from the University campus and İbradı Eynif pasture are given below. In this plant, compare whether there is a difference between regions in terms of spike height. Virgo Height (cm) Data obtained from plants collected from university campus 5 6 8 7 8 6 5 5 4 6 6 Data obtained from plants collected from Eynif pasture 12 9 11 9 9 11 9 10 11 10 Note: Your results interpretation according to two different possibilities (Do it separately, assuming that it is 0.07 and 0.04).The aging Neotropical termites (Neocapritermes taracua) secrete a sticky, blue-colored liquid that they spew to intruding termites. The younger Neotropical termites secrete a liquid that lacks the blue component, so it is white in appearance. In an experiment that measured the toxicity of the blue substance, the researchers placed one drop of either the blue liquid or the white liquid on individuals of a second termite species, Labiotermes labralis. Of the 41 Labiotermes labralis that got the blue drop, 37 were immobilized. Of the 40 Labiotermes labralis that got the white drop, 9 were immobilized. Is the blue liquid toxic compared to the white liquid?