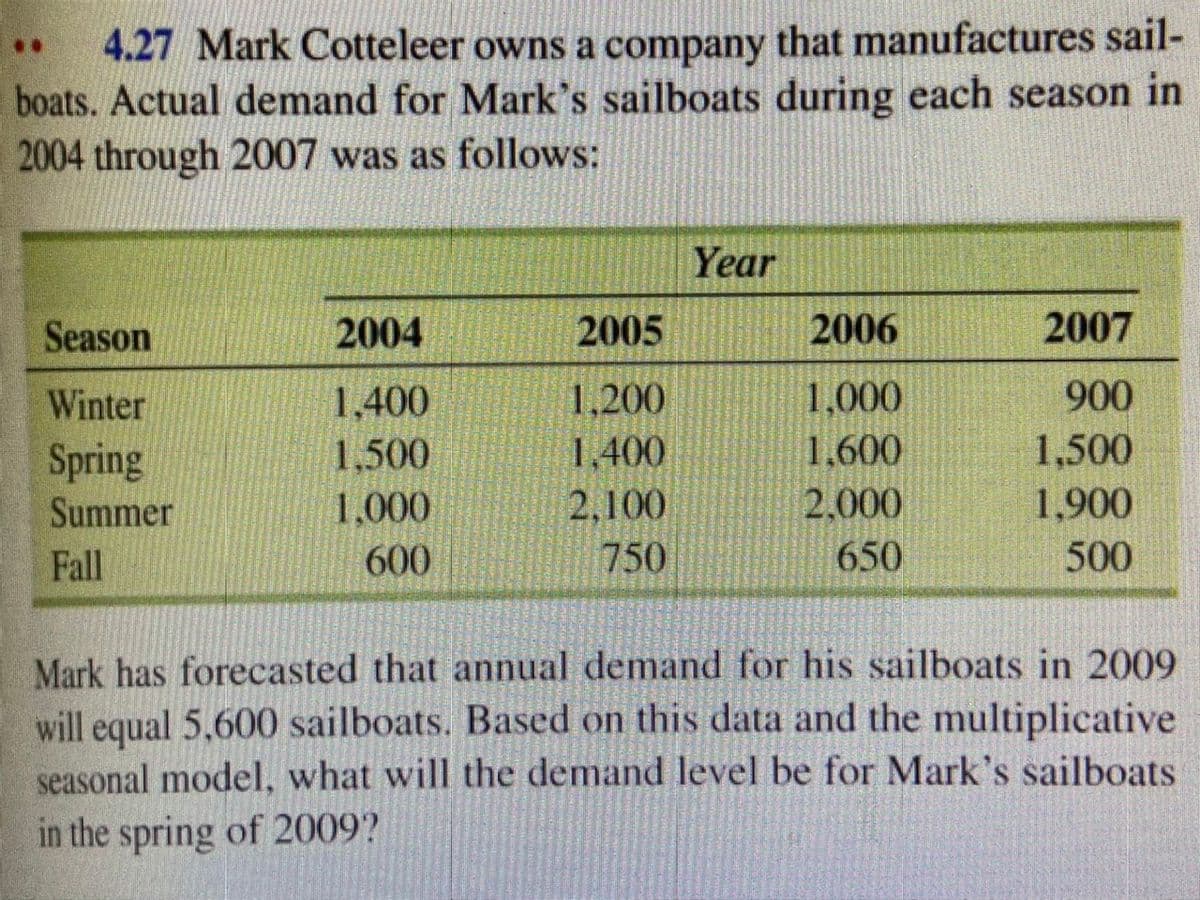
4.27 Mark Cotteleer owns a company that manufactures sail- boats. Actual demand for Mark's sailboats during each season in 2004 through 2007 was as follows: Year Season 2004 2005 2006 2007 Winter 1,400 1,200 1,000 900 1,400 2,100 1.600 1,500 Spring Summer 1,500 1,000 2.000 1,900 Fall 600 750 650 500 Mark has forecasted that annual demand for his sailboats in 2009 will equal 5,600 sailboats. Based on this data and the multiplicative seasonal model, what will the demand level be for Mark's sailboats in the spring of 2009?


Q: Lenovo uses the ZX-81 chip in some of its laptop computers. The prices for the chip during the last…
A:
Q: Solve the following: 1. Sales of Volkwagen’s popular Beetle have grown steadily at auto dealership…
A: Formula used to calculate the Forecast for years 2 to 6 = Forecast of previous year + α(Previous…
Q: Forecasting Ticket Revenue for Orlando Magic Basketball Games For its first two decades of…
A: Given data, Team Date Day of Week Time of Year Rating of the opponent Additional sales…
Q: (4) Weekly demand for dry pasta at a supermarket chain is as follows Week Demands 1 517 2 510…
A:
Q: Data collected on the yearly demand for 50-pound bags of fertilizer at Wallace Garden Supply are…
A:
Q: Lenovo uses the ZX-81 chip in some of its laptop computers. The prices for the chip during the last…
A:
Q: George Kyparisis owns a company that manufactures sailboats. Actual demand for George's sailboats…
A: Find the given details below: Given details: Year Season 1 2 3 4 Winter 1400 1200 1000…
Q: Ed Rogers owns an appliance store. Sales data on a particular model of a DVD player for the past six…
A: Using the above formulae : Actual of May = 51 Forecast of May = 36.25 alpha = 0.4 Forecast of…
Q: The number of internal disk drives (in millions) made at a plant in Taiwan during the past 5 years…
A: Find the Given details below: Given Details: Year Disk Drives 1 138 2 156 3 184 4 202…
Q: The number of disk drives (in millions) made at a plant in Taiwan during the past 5 years follows.…
A: Given data:
Q: Ralph Billett is the manager of a real estate agency. He now wishes to develop a forecast of the…
A: Find the Given details below: Given details: Sales (Year) Quarter 1 2 3 1 30 59 71 2…
Q: Sales of Volkswagen's popular Beetle have grown steadily at auto dealerships in Nevada during the…
A: When α=0.30 Period Sales Forecasted Sales Actual - Forecast 2005 455 415 40 2006 510 427 83…
Q: The president of the Southern University wants to forecast student enrolments for this academic year…
A: Given data
Q: George Kyparisis owns a company that manufacturessailboats. Actual demand for George's sailboats…
A: Demand forecasting is nothing but the approach of utilizing forecasted analysis of previous or past…
Q: Small Wonder, an amusement park, experiences seasonalattendance. It has collected two years of…
A: Seasonal index = Attendance in the quarterAverage attendance Average demand per season = Annual…
Q: George Kyparisis owns a company that manufac-tures sailboats. Actual demand for George’s sailboats…
A: Seasons Winter Spring Summer Fall 1 1400 1500 1000 600 2 1200 1400 2100 750 3 1000 1600 2000…
Q: George Kyparisis owns a company that manufactures sailboats. Actual demand for George's sailboats…
A: The concept used here is forecasting using the Seasonal index method.
Q: Alvin Cheah is a marketing analyst for Rockstar Travel Company. He wants to analyze the trend of…
A: The forecast model proposed for this question is the regression forecast analysis. The regression…
Q: Explain how is moving average approach related to exponential smoothing?
A: A time series is a sequence of observations which may be ordered in time. Inherent withinside the…
Q: 6. Tutoring Center needs to allocate tutors this week for office appointments, so it needs to…
A: Note: - Since we can answer only up to three subparts we will answer the first three(a, b, and c)…
Q: • 4.29 The number of disk drives (in millions) made at a plant in Taiwan during the past 5 years…
A:
Q: Calanute Beach Resort, a fictional seaside luxury hotel in Goa, India, had the following occupancy…
A: Find the Given details below: Given details: Month Occupancy Rate in % 1 65 2 68 3 72 4…
Q: TOC/ Tunis Oil Co. started 4 months ago. TOC noticed that its production increased significantly.…
A: The weighted moving average is calculated by multiplying each observation in the data set by a…
Q: George Kyparisis owns a company that manufactures sailboats. Actual demand for George's sailboats…
A: Calculation of average sales for each season: Season 1 2 3 4 Average Winter 1400 1200 1000 960…
Q: XYZ Chips Inc. (XCI) produces Centrino-type chips. The market has been inclining with ups and downs…
A: Forecasting Technique we are using here is Moving average forecasting Technique: A moving average is…
Q: Sunrise is planning its purchases of ingredients for bread production. If bread demand had been…
A: Exponential smoothing could be a statistic statement technique for univariate information that may…
Q: Lenovo uses the ZX-81 chip in some of its laptop computers. The prices for the chip during the last…
A: Exponential smoothing forecast formula - Ft+1= α×At + (1-α)FtWhere α = Smoothing constant Ft+1=…
Q: Lori Cook has developed the following forecasting model: y = 40.0 + 4.20x, where y = demand for Kool…
A: Y = 40 + 4.20x Where, Y = Demand for Air Conditioners X = Outside temperature
Q: 12-1. The Hartley-Davis motorcycle dealer in the Minneapolis- St. Paul area wants to be able to…
A: Given - Month Sales January 9 February 7 March 10 April 8 May 7 June 12 July 10…
Q: Winter’s method is being used to forecast quarterlyU.S. retail sales (in billions of dollars). At…
A:
Q: The number of disk drives (in millions) made at a plant in Taiwan during the past 5 years follows:…
A: The forecast of disks to be produced next year can be computed as follows:
Q: Given the following data of actual sales and forecast for the five months: Month 1, Month 2, Month…
A: The mean absolute error percentage (MAPE) is the average value of absolute error values. Mean square…
Q: Daily high temperatures in St. Louis for the last week were as follows: 92, 91, 95, 95, 96,…
A: From given data :-Day 1 2 3 4 5 6 7 Temp 92 91 95 95…
Q: How is a seasonal index computed from a regression line analysis?
A: A seasonal index is defined as the amount of correction/adjustment needed in parameters (Sales.…
Q: Lenovo uses the ZX-81 chip in some of its laptop computers. The prices for the chip during the last…
A:
Q: What is the purpose of establishing control limits for forecast errors?
A: Forecast errors are described as the difference between the forecast of a particular period and that…
Q: FORECASTING Sales of industrial vacuum cleaners at Yarena Supply CO. over the past 13 months are…
A: Moving average forecasting is utilized in a wide range of exchange methodologies. Accordingly,…
Q: 3. The weekly demand for units manufactured by the Orion Company Limited has been as follows: Week 1…
A: Formula:
Q: Sales of Volkswagen's popular Beetle have grown steadily at auto dealerships in Nevada during the…
A: The exponential smoothing method is a type of forecasting technique. This method is suitable for…
Q: 12.2. The manager of the I-85 Carpet Outlet needs to be able to forecast accurately the demand for…
A: Given-
Q: Lenovo uses the ZX-81 chip in some of its laptop computers. The prices for the chip during the last…
A: As required, we have to find the answers to part b) only. The 3-month moving average forecast for a…
Q: Week Of Pints Used August 31 September 7 September 14 September 21 September 28 October 5 345 370…
A: c) Exponential smoothing is also the forecasting technique. In this method of forecasting, alpha is…
Q: The number of major plumbing repair jobs performed by Augur’s Plumbing Service in each of the last…
A: Three-point averages are calculated by taking a number in the series with the previous and next…
Q: Tom Glass forecasts electrical demand for the FlatlandsPublic Power District (FPPD). The FPPD wants…
A: Customer demand planning Customer demand planning is a process of business planning that helps sales…
Q: The following table gives the number of pints of type A blood used at Damascus Hospital in the past…
A: Given data is
Q: If the demand in the current week was 102 units and we had forecast it to be 125, what would be next…
A: Exponential smoothing is a time series forecasting technique that forecasts data for a given period…
Q: 0. During the past five months the emergency new County Hospital has observed the number of patients…
A: Seasonal adjustment is a strategy for information smoothing that is utilized to foresee monetary…
Q: Develop a linear regression model relating printer sales to computer sales in order to forecast…
A: THE ANSWER IS AS BELOW:
Q: Lenovo uses the ZX-81 chip in some of its laptop computers. The prices for the chip during the last…
A:
Question 4.27


Trending now
This is a popular solution!

Step by step
Solved in 2 steps

- When you use a RISKSIMTABLE function for a decision variable, such as the order quantity in the Walton model, explain how this provides a fair comparison across the different values tested.In Example 11.1, the possible profits vary from negative to positive for each of the 10 possible bids examined. a. For each of these, use @RISKs RISKTARGET function to find the probability that Millers profit is positive. Do you believe these results should have any bearing on Millers choice of bid? b. Use @RISKs RISKPERCENTILE function to find the 10th percentile for each of these bids. Can you explain why the percentiles have the values you obtain?A company manufacturers a product in the United States and sells it in England. The unit cost of manufacturing is 50. The current exchange rate (dollars per pound) is 1.221. The demand function, which indicates how many units the company can sell in England as a function of price (in pounds) is of the power type, with constant 27556759 and exponent 2.4. a. Develop a model for the companys profit (in dollars) as a function of the price it charges (in pounds). Then use a data table to find the profit-maximizing price to the nearest pound. b. If the exchange rate varies from its current value, does the profit-maximizing price increase or decrease? Does the maximum profit increase or decrease?
- An automobile manufacturer is considering whether to introduce a new model called the Racer. The profitability of the Racer depends on the following factors: The fixed cost of developing the Racer is triangularly distributed with parameters 3, 4, and 5, all in billions. Year 1 sales are normally distributed with mean 200,000 and standard deviation 50,000. Year 2 sales are normally distributed with mean equal to actual year 1 sales and standard deviation 50,000. Year 3 sales are normally distributed with mean equal to actual year 2 sales and standard deviation 50,000. The selling price in year 1 is 25,000. The year 2 selling price will be 1.05[year 1 price + 50 (% diff1)] where % diff1 is the number of percentage points by which actual year 1 sales differ from expected year 1 sales. The 1.05 factor accounts for inflation. For example, if the year 1 sales figure is 180,000, which is 10 percentage points below the expected year 1 sales, then the year 2 price will be 1.05[25,000 + 50( 10)] = 25,725. Similarly, the year 3 price will be 1.05[year 2 price + 50(% diff2)] where % diff2 is the percentage by which actual year 2 sales differ from expected year 2 sales. The variable cost in year 1 is triangularly distributed with parameters 10,000, 12,000, and 15,000, and it is assumed to increase by 5% each year. Your goal is to estimate the NPV of the new car during its first three years. Assume that the company is able to produce exactly as many cars as it can sell. Also, assume that cash flows are discounted at 10%. Simulate 1000 trials to estimate the mean and standard deviation of the NPV for the first three years of sales. Also, determine an interval such that you are 95% certain that the NPV of the Racer during its first three years of operation will be within this interval.Play Things is developing a new Lady Gaga doll. The company has made the following assumptions: The doll will sell for a random number of years from 1 to 10. Each of these 10 possibilities is equally likely. At the beginning of year 1, the potential market for the doll is two million. The potential market grows by an average of 4% per year. The company is 95% sure that the growth in the potential market during any year will be between 2.5% and 5.5%. It uses a normal distribution to model this. The company believes its share of the potential market during year 1 will be at worst 30%, most likely 50%, and at best 60%. It uses a triangular distribution to model this. The variable cost of producing a doll during year 1 has a triangular distribution with parameters 15, 17, and 20. The current selling price is 45. Each year, the variable cost of producing the doll will increase by an amount that is triangularly distributed with parameters 2.5%, 3%, and 3.5%. You can assume that once this change is generated, it will be the same for each year. You can also assume that the company will change its selling price by the same percentage each year. The fixed cost of developing the doll (which is incurred right away, at time 0) has a triangular distribution with parameters 5 million, 7.5 million, and 12 million. Right now there is one competitor in the market. During each year that begins with four or fewer competitors, there is a 25% chance that a new competitor will enter the market. Year t sales (for t 1) are determined as follows. Suppose that at the end of year t 1, n competitors are present (including Play Things). Then during year t, a fraction 0.9 0.1n of the company's loyal customers (last year's purchasers) will buy a doll from Play Things this year, and a fraction 0.2 0.04n of customers currently in the market ho did not purchase a doll last year will purchase a doll from Play Things this year. Adding these two provides the mean sales for this year. Then the actual sales this year is normally distributed with this mean and standard deviation equal to 7.5% of the mean. a. Use @RISK to estimate the expected NPV of this project. b. Use the percentiles in @ RISKs output to find an interval such that you are 95% certain that the companys actual NPV will be within this interval.Suppose that a regional express delivery service company wants to estimate the cost of shipping a package (Y) as a function of cargo type, where cargo type includes the following possibilities: fragile, semifragile, and durable. Costs for 15 randomly chosen packages of approximately the same weight and same distance shipped, but of different cargo types, are provided in the file P13_16.xlsx. a. Estimate a regression equation using the given sample data, and interpret the estimated regression coefficients. b. According to the estimated regression equation, which cargo type is the most costly to ship? Which cargo type is the least costly to ship? c. How well does the estimated equation fit the given sample data? How might the fit be improved? d. Given the estimated regression equation, predict the cost of shipping a package with semifragile cargo.
- The annual demand for Prizdol, a prescription drug manufactured and marketed by the NuFeel Company, is normally distributed with mean 50,000 and standard deviation 12,000. Assume that demand during each of the next 10 years is an independent random number from this distribution. NuFeel needs to determine how large a Prizdol plant to build to maximize its expected profit over the next 10 years. If the company builds a plant that can produce x units of Prizdol per year, it will cost 16 for each of these x units. NuFeel will produce only the amount demanded each year, and each unit of Prizdol produced will sell for 3.70. Each unit of Prizdol produced incurs a variable production cost of 0.20. It costs 0.40 per year to operate a unit of capacity. a. Among the capacity levels of 30,000, 35,000, 40,000, 45,000, 50,000, 55,000, and 60,000 units per year, which level maximizes expected profit? Use simulation to answer this question. b. Using the capacity from your answer to part a, NuFeel can be 95% certain that actual profit for the 10-year period will be between what two values?Assume the demand for a companys drug Wozac during the current year is 50,000, and assume demand will grow at 5% a year. If the company builds a plant that can produce x units of Wozac per year, it will cost 16x. Each unit of Wozac is sold for 3. Each unit of Wozac produced incurs a variable production cost of 0.20. It costs 0.40 per year to operate a unit of capacity. Determine how large a Wozac plant the company should build to maximize its expected profit over the next 10 years.You want to take out a 450,000 loan on a 20-year mortgage with end-of-month payments. The annual rate of interest is 3%. Twenty years from now, you will need to make a 50,000 ending balloon payment. Because you expect your income to increase, you want to structure the loan so at the beginning of each year, your monthly payments increase by 2%. a. Determine the amount of each years monthly payment. You should use a lookup table to look up each years monthly payment and to look up the year based on the month (e.g., month 13 is year 2, etc.). b. Suppose payment each month is to be the same, and there is no balloon payment. Show that the monthly payment you can calculate from your spreadsheet matches the value given by the Excel PMT function PMT(0.03/12,240, 450000,0,0).
- Based on Babich (1992). Suppose that each week each of 300 families buys a gallon of orange juice from company A, B, or C. Let pA denote the probability that a gallon produced by company A is of unsatisfactory quality, and define pB and pC similarly for companies B and C. If the last gallon of juice purchased by a family is satisfactory, the next week they will purchase a gallon of juice from the same company. If the last gallon of juice purchased by a family is not satisfactory, the family will purchase a gallon from a competitor. Consider a week in which A families have purchased juice A, B families have purchased juice B, and C families have purchased juice C. Assume that families that switch brands during a period are allocated to the remaining brands in a manner that is proportional to the current market shares of the other brands. For example, if a customer switches from brand A, there is probability B/(B + C) that he will switch to brand B and probability C/(B + C) that he will switch to brand C. Suppose that the market is currently divided equally: 10,000 families for each of the three brands. a. After a year, what will the market share for each firm be? Assume pA = 0.10, pB = 0.15, and pC = 0.20. (Hint: You will need to use the RISKBINOMLAL function to see how many people switch from A and then use the RISKBENOMIAL function again to see how many switch from A to B and from A to C. However, if your model requires more RISKBINOMIAL functions than the number allowed in the academic version of @RISK, remember that you can instead use the BENOM.INV (or the old CRITBENOM) function to generate binomially distributed random numbers. This takes the form =BINOM.INV (ntrials, psuccess, RAND()).) b. Suppose a 1% increase in market share is worth 10,000 per week to company A. Company A believes that for a cost of 1 million per year it can cut the percentage of unsatisfactory juice cartons in half. Is this worthwhile? (Use the same values of pA, pB, and pC as in part a.)You are considering a 10-year investment project. At present, the expected cash flow each year is 10,000. Suppose, however, that each years cash flow is normally distributed with mean equal to last years actual cash flow and standard deviation 1000. For example, suppose that the actual cash flow in year 1 is 12,000. Then year 2 cash flow is normal with mean 12,000 and standard deviation 1000. Also, at the end of year 1, your best guess is that each later years expected cash flow will be 12,000. a. Estimate the mean and standard deviation of the NPV of this project. Assume that cash flows are discounted at a rate of 10% per year. b. Now assume that the project has an abandonment option. At the end of each year you can abandon the project for the value given in the file P11_60.xlsx. For example, suppose that year 1 cash flow is 4000. Then at the end of year 1, you expect cash flow for each remaining year to be 4000. This has an NPV of less than 62,000, so you should abandon the project and collect 62,000 at the end of year 1. Estimate the mean and standard deviation of the project with the abandonment option. How much would you pay for the abandonment option? (Hint: You can abandon a project at most once. So in year 5, for example, you abandon only if the sum of future expected NPVs is less than the year 5 abandonment value and the project has not yet been abandoned. Also, once you abandon the project, the actual cash flows for future years are zero. So in this case the future cash flows after abandonment should be zero in your model.)